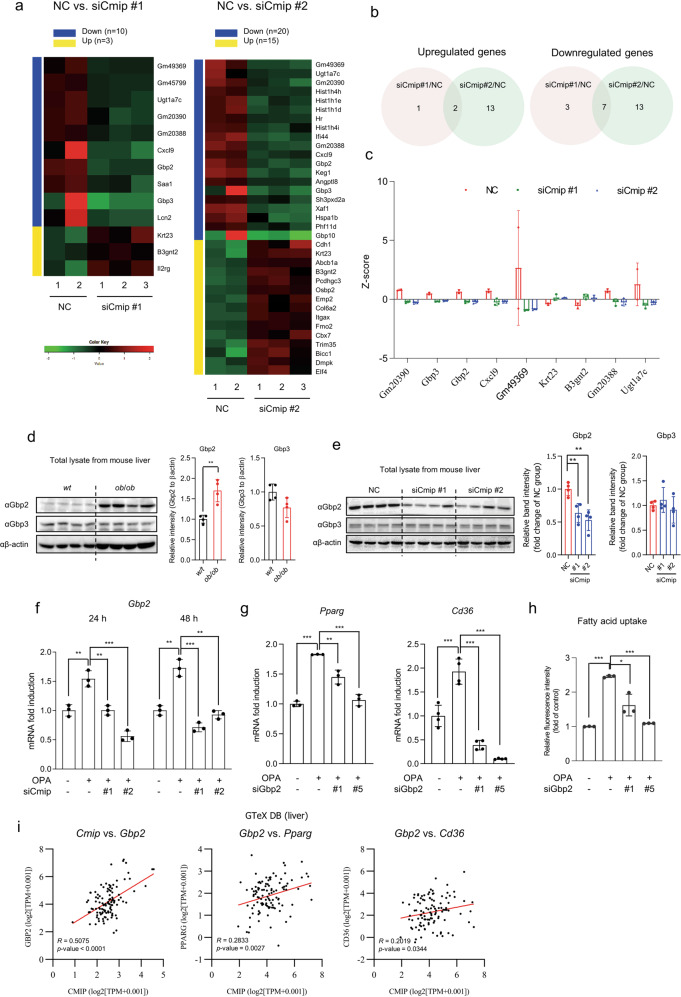
Fig. 7. Gbp2 mediates the regulation of the Pparγ–Cd36 axis downstream of Cmip.
a Heatmap visualization of the differentially expressed genes (DEGs) between Cmip knockdown and negative control (NC) mice. Two Cmip siRNAs (siCmip#1 and siCmip#2) were used for in vivo Cmip knockdown. The significant DEGs were selected as follows: |log fold-change|≥1; p < 0.05. b Venn diagrams representing the overlap of the upregulated DEGs in siCmip#1 vs. NC and siCmip#2 vs. NC (left panel) and that of the downregulated DEGs (right panel). c The expression levels of overlapping DEGs (n = 9) in the livers of Cmip knockdown and NC mice. The expression levels of each gene were expressed as Z-scores. d Gbp2 and Gbp3 expression in liver tissues in either wildtype (wt) or ob/ob mice. The protein levels of Gbp2 and Gbp3 in liver tissues in wt or ob/ob mice were detected by western blotting (n = 4/group). **p < 0.01; Student’s t-test. The intensities of the protein bands obtained from the western blot assays were quantified with FusionCapt Advance Solo 7 software and normalized with respect to the intensity of β-actin. The relative fold intensity was calculated by the sum of normalized intensities from each protein band. *p < 0.05; Student’s t-test. e Western blots of Gbp2 and Gbp3 expression in Cmip knockdown mice (n = 4/group). The intensities of the protein bands were quantified with FusionCapt Advance Solo 7 software and normalized with respect to the intensity of β-actin. The relative fold intensity was calculated as the sum of the normalized intensities from each protein band. **p < 0.01; Student’s t-test. f Gbp2 mRNA expression in Cmip knockdown AML12 cells, measured following siCmip transfection in the presence of oleic acid and palmitic acid (OPA). The values presented are the means ± SDs of three independent experiments. **p < 0.01 and ***p < 0.001; Student’s t-test. g Pparγ and Cd36 mRNA expression in Gbp2 knockdown AML12 cells, measured following siGbp2 transfection in the presence of OPA. The values presented are the means ± SDs of three independent experiments. **p < 0.01 and ***p < 0.001; Student’s t-test. h Fatty acid uptake in Gbp2 knockdown AML12 cells, measured following Gbp2 siRNA transfection. *p < 0.05, **p < 0.01, and ***p < 0.001; Student’s t-test. i Correlations of the relative influence between CMIP vs. GBP2, GBP2 vs. PPARγ, and GBP2 vs. CD36 in human livers. Correlations were analyzed using transcriptome data of human liver tissues (n = 110) from the Genotype-Tissue Expression (GTeX) database. Correlations are expressed as Pearson correlation coefficients (R).

