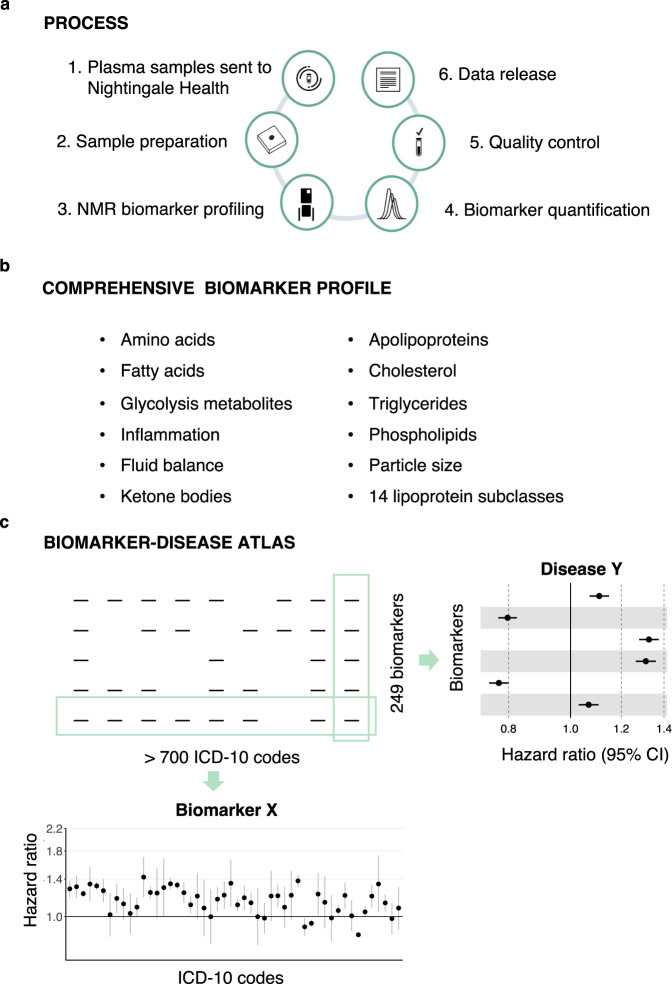
Fig. 1. Nuclear magnetic resonance (NMR) biomarker data in the UK Biobank and atlas of disease associations.
a Process of the Nightingale Health-UK Biobank Initiative: 1) EDTA plasma samples from the baseline survey were prepared on 96-well plates and shipped to Nightingale Health laboratories in Finland, 2) Buffer was added and samples transferred to NMR tubes, 3) Samples were measured using six 500 MHz proton NMR spectrometers, 4) Automated spectral processing software was used to quantify 249 biomarker measures from each sample, 5) Quality control metrics based on blind duplicates and internal control samples were used to track consistency metrics throughout the project, 6) Biomarker data were cleaned, provided to UK Biobank and released to the research community. b Overview of biomarker types included in the Nightingale Health NMR biomarker panel. c Schematic illustration of the atlas of biomarker-disease associations published along with this study. The webtool allows to display the associations of all biomarkers versus prevalence, incidence and mortality of each disease endpoint, as well as show each biomarker versus all disease endpoints.

