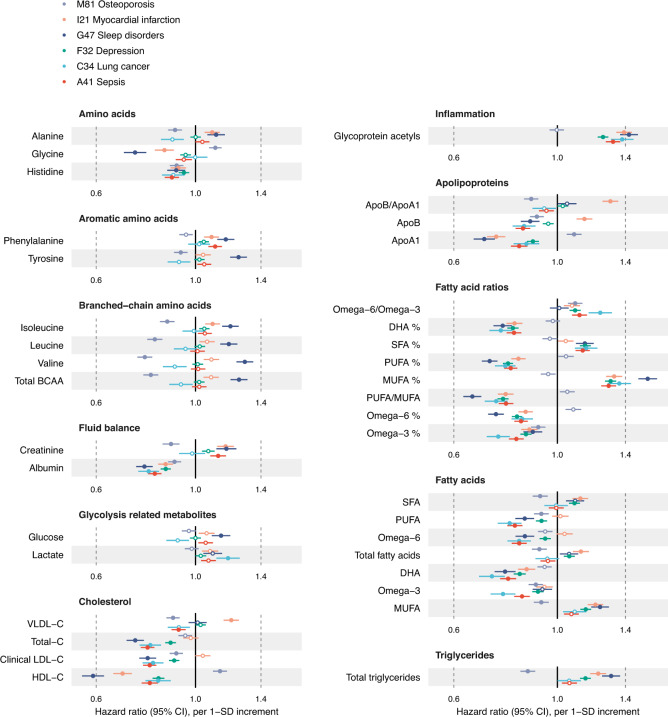
Fig. 3. Biomarker profiles for the incidence of various types of diseases.
Hazard ratios of biomarkers with the incidence of six disease examples: A41 Sepsis (red; n = 117,806, 2986 events), C34 Lung cancer (light blue; n = 117,964, 1210 events), F32 Depression (green; n = 116,993, 5455 events), G47 Sleep disorders (dark blue; n = 117,325, 1865 events), I21 Myocardial infarction (orange; n = 116,797, 2523 events) and M81 Osteoporosis (lavender; n = 117,538, 3326 events). Data are presented as hazard ratios and 95% confidence intervals (CI), per SD-scaled biomarker concentrations. The models were adjusted for age, sex and UK biobank assessment centre, using age as the timescale of the Cox proportional hazards regression. Filled points indicate statistically significant associations (p < 5e-5), and hollow points are non-significant ones. Similar forest plots for all 249 NMR biomarkers across all endpoints analysed are provided in the biomarker-disease atlas webtool. BCAA indicates branched-chain amino acids, DHA docosahexaenoic acid; MUFA monounsaturated fatty acids, PUFA polyunsaturated fatty acids, SFA saturated fatty acids. Source data are provided as a Source Data file.

