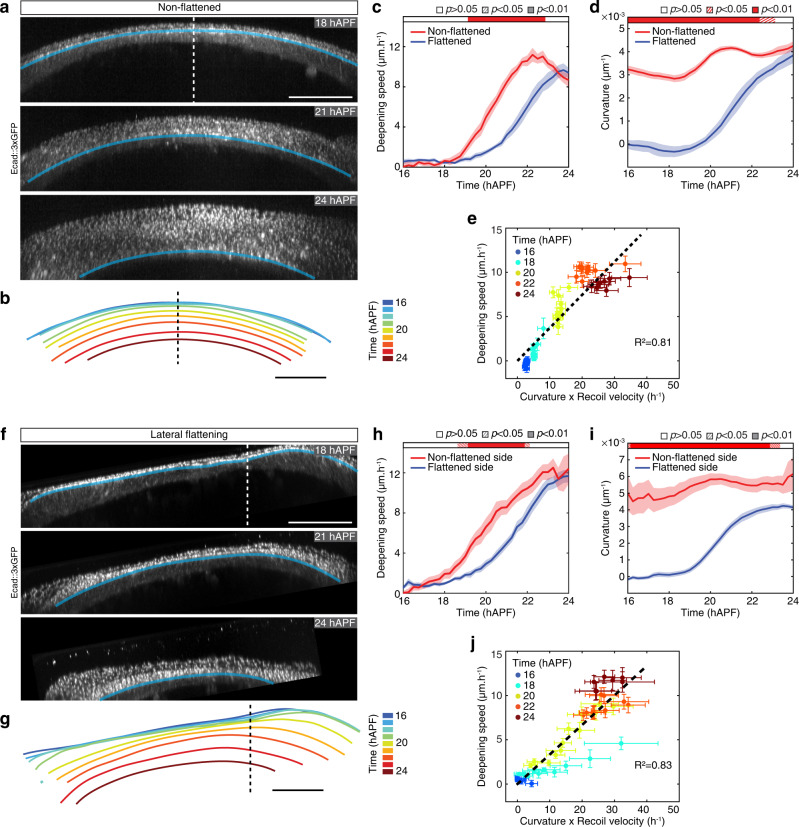
Fig. 6. Local curvature along the neck fold controls folding dynamics.
a Transverse view time-lapse images of the neck region labeled by Ecad::3×GPF at 18, 21, and 24 hAPF in a non-flattened pupa (i.e., imaged without coverslip flattening). Blue line, the position of the apical fold front. Dashed line, midline position. See also Supplementary Movie 4. b Successive positions of the apical fold front, color-coded according to time, in a pupa imaged without coverslip flattening (a). Dashed line, midline position. c Graph of apical fold front deepening speed (mean ± sem) in pupae imaged without coverslip flattening (non-flattened, N = 11 pupae) and with coverslip flattening (flattened, N = 101 pupae) as a function of developmental time. Horizontal box: p-values of Welch tests performed between non-flattened and flattened experimental conditions at successive time points (white p > 0.05, striped p < 0.05, solid p < 0.01). d Graph of curvature (mean ± sem) in pupae imaged without coverslip flattening (non-flattened, N = 110 pupae) and with coverslip flattening (flattened, N = 10 pupae) as a function of developmental time. Horizontal box: p-values of Welch tests performed between non-flattened and flattened experimental conditions at successive time points (white p > 0.05, striped p < 0.05, solid p < 0.01). e Graph of the apical fold front deepening speed (mean ± sem) and of the product of curvature and ML apical initial recoil velocity upon laser ablation in the neck region (mean ± sem) in pupae imaged without coverslip flattening for a given PositionML at a given color-coded developmental time. Datasets from Fig. 6c, d and Supplementary Fig. 11a were used (see corresponding figure legends for sample size). A line passing through the origin was fitted (R2 = 0.81). f Transverse view time-lapse images of the neck region labeled by Ecad::3×GPF at 18, 21, and 24 hAPF in a pupa flattened laterally relative to the midline. Blue line, the position of the apical fold front. Dashed line, midline position. g Successive positions of the apical fold front, color-coded according to time, in a pupa laterally flattened (f). Dashed line, midline position. See also Supplementary Movie 4. h Graph of apical fold front deepening speed (mean ± sem) of the non-flattened side and flattened side in pupae laterally flattened relative to the midline (as in (f), N = 11) as a function of developmental time. Horizontal box: p-values of Welch tests performed between the non-flattened side and flattened side of the same pupae at successive time points (white p > 0.05, striped p < 0.05, solid p < 0.01). i Graph of curvature (mean ± sem) of the non-flattened side and flattened side in pupaeflattened laterally relative to the midline (as in (f), N = 11) as a function of developmental time. Horizontal box: p-values of Welch tests performed between the non-flattened side and flattened side of the same pupae at successive time points (white p > 0.05, striped p < 0.05, solid p < 0.01). j Graph of the apical fold front deepening speed (mean ± sem) and of the product of curvature and ML apical initial recoil velocity upon laser ablation in the neck region (mean ± sem) in laterally flattened pupae for a given PositionML at a given color-coded developmental time. Recoil velocities measured in flattened animals (Fig. 2c, see corresponding figure legends for sample size) were used for regions of initial curvatures below a threshold of 0.00015 µm−1, while recoil velocities measured in non-flattened animals (Supplementary Fig. 11a) were used for regions of initial curvatures larger than 0.00015 µm−1. A line passing through the origin was fitted (R2 = 0.83). Source data are provided as a Source Data file. Scale bars, 50 µm.

