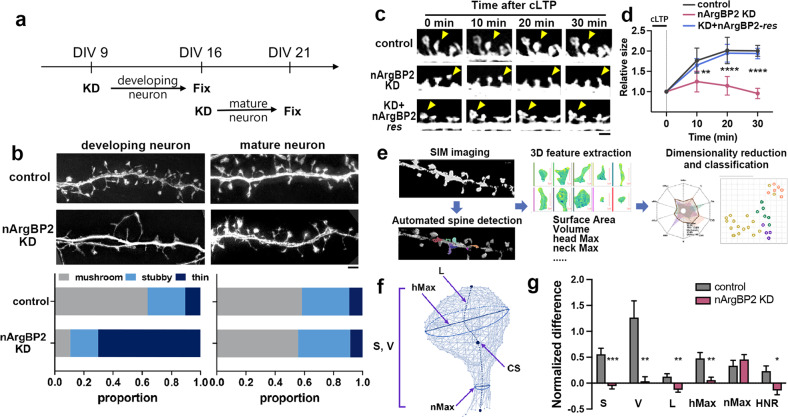
Fig. 1. nArgBP2 KD in mature neurons does not result in morphological defects in existing dendritic spines but completely inhibits spine head enlargement during cLTP.
a Schematic overview of nArgBP2 KD in developing and mature neurons. b Representative images of spine morphologies and the proportions of mushroom-shaped, stubby, and thin spines in neurons expressing control or shRNA-nArgBP2 in developing neurons and mature neurons. Developing neurons were transfected at DIV 9 and fixed at DIV 16, whereas mature neurons were transfected at DIV 16 and fixed at DIV 21. Scale bar: 2 μm. The proportion of each is shown above the bar. c Representative time-lapse images of spines in control and nArgBP2 KD neurons during cLTP induction. Neurons at DIV 16 were transfected with shRNA-nArgBP2 alone or combined with EGFP-nArgBP2-res and were imaged at DIV 21. Note the gradual enlargement of the spine heads in control and KD + EGFP-nArgBP2-res neurons but not in KD neurons. The yellow arrowheads indicate the spine heads. Scale bars: 2 μm. d The relative size of spine heads in control and nArgBP2 KD neurons after cLTP, normalized to the initial value. n = 9 for control, 11 for KD, and 7 for KD + EGFP-nArgBP2-res (one-way ANOVA followed by Tukey’s HSD test). *p < 0.05; **p < 0.01. Error bars indicate the means ± s.e.m.s. e Schematic diagram of the process of 3D geometry analysis of dendritic spines using DXplorer. The left panel shows the acquisition of 3D-SIM images and automatic detection of dendritic spines. 3D geometrical features were extracted and calculated. The datasets were further analyzed and classified by dimensionality reduction and machine-learning-based automatic classification. f Representative morphological features extracted from the 3D mesh of dendritic spines. S, Surface; V, Volume; L, length of spine; hMax, the maximum diameter of the spine head; nMax, the maximum diameter of the spine neck; CS, the centroid of the spine. g Normalized differences in morphological features of spines between pre-and post cLTP in control and nArgBP2 KD neurons. HNR, the ratio of head to the neck (HNR = hMax/nMax); n = 39 for control, 34 for KD. *p < 0.05; **p < 0.01; ***p < 0.001. Student’s t-test; error bars indicate the mean ± s.d.

