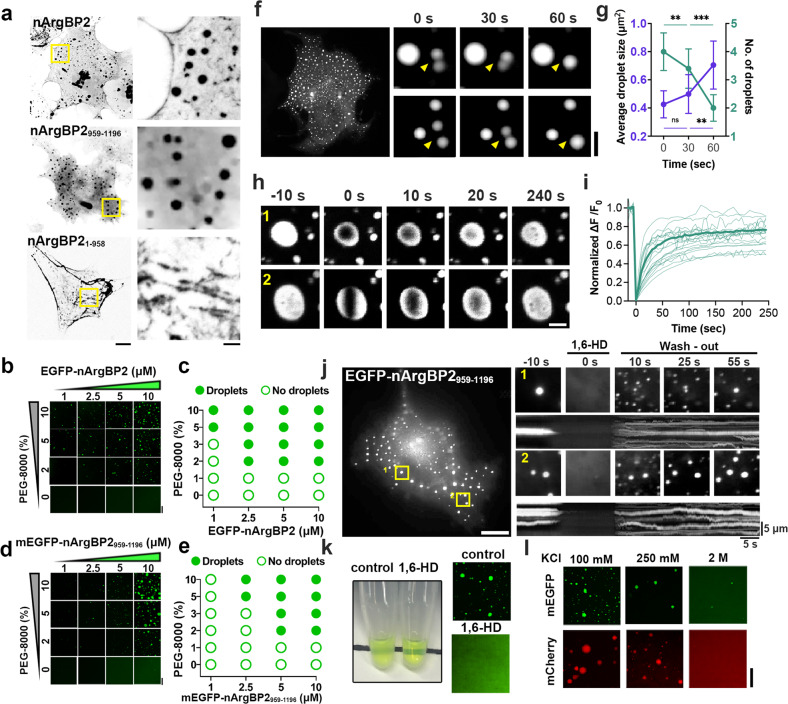
Fig. 3. Biomolecular condensate assembly of nArgBP2 in heterologous and in vitro expression systems.
a Representative images of EGFP-tagged full-length nArgBP2, nArgBP2959-1196, and SH3 deletion mutant expressed in COS7 cells imaged 48 h after transfection. Scale bar: 10 µm. b–e Fluorescence images of purified EGFP-nArgBP2 or mEGFP-nArgBP2959-1196 over a range of protein concentrations with or without the crowding agent PEG-8000. Note that the formation of droplets is facilitated, and the size of droplets increases as the concentration of protein or PEG-8000 increases. Scale bar: 20 μm. Phase diagram showing droplet formation by EGFP-nArgBP2 (c) and mEGFP-nArgBP2959-1196 e with PEG-8000 in vitro. Filled circles indicate that mEGFP-nArgBP2959-1196 formed liquid droplets via LLPS, while empty circles indicate that it did not. f–j COS7 cells were transfected with EGFP-nArgBP2959-1196 and imaged after 48 h. f Representative fluorescence images of droplets that underwent fusion over time (yellow arrowheads). Scale bars: 20 μm and 2 μm, respectively. g Time-dependent changes in the number and average size of droplets. n = 10 (0, 30, and 60 s) cells from three independent assays. Average droplet size, 0 s = 0.43 ± 0.09; 30 s = 0.50 ± 0.13; 60 s = 0.70 ± 0.17; values are means ± s.d. One-way ANOVA followed by Tukey’s HSD test. 0 s & 60 s ***p = 0.0003, 30 s & 60 s **p = 0.0070. h Representative time-lapse images showing fluorescence recovery after photobleaching EGFP-nArgBP2959-1196 droplets. Either round or cylindrical-shaped bleached areas were created. Scale bar: 2 μm. i Plots of normalized fluorescence intensity traces after photobleaching of multiple droplets. The average fluorescence intensity was traced as a thick line (n = 22). j Droplets are reversibly dispersed by 3% 1,6-hexanediol. Right: time-lapse images and kymographs of EGFP-nArgBP2959-1196 droplets are indicated by yellow rectangles in the low-magnification image. Scale bar: 20 μm. k Droplets of EGFP-nArgBP2959-1196 dissolved the addition of 10% 1,6-hexanediol (1,6-HD). (Top) The solution of purified EGFP-nArgBP2959-1196, which had been turbid due to phase separation, became clear after adding 1,6-HD. (Bottom) Fluorescence images of purified EGFP-nArgBP2959-1196 with or without 1,6-HD. Scale bar: 20 μm. l Fluorescence images showing the effect of salt concentration on nArgBP2959-1196 droplet formation. Five micromolar purified mEGFP- or mCherry-tagged nArgBP2959-1196 protein was dissolved in 5% PEG-8000 buffer (25 mM HEPES [pH 7.4] with various concentrations of KCl). Elevated KCl weakens droplet formation via LLPS. Scale bar: 20 μm.

