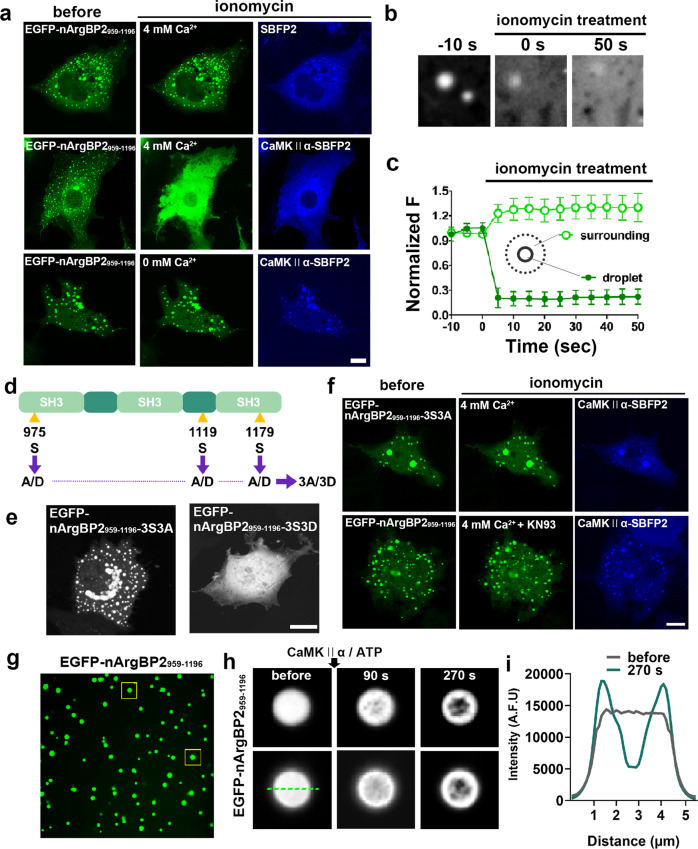
Fig. 4. Biomolecular condensate coassembly of nArgBP2 with CaMKIIα and rapid dispersion by Ca2+/CaMKIIα-mediated phosphorylation.
a Representative fluorescence images of COS7 cells transfected with EGFP-nArgBP2959-1196 and SBFP2 empty vector or CaMKIIα-SBFP2. EGFP-nArgBP2959-1196 droplets coexpressed with CaMKIIα-SBFP2 dispersed upon ionomycin treatment in 4 mM Ca2+ Tyrode (middle), while no effect on the droplets was observed without CaMKIIα coexpression (top) or in the absence of extracellular Ca2+ (bottom). Scale bar: 20 μm. b Enlarged time-lapse images of EGFP-nArgBP2959-1196 droplets coexpressed with CaMKIIα-SBFP2 in the middle panel of Fig. 4a before and after ionomycin treatment. Scale bar: 1 μm. c Plot of the normalized average fluorescence intensity profiles of EGFP-nArgBP2959-1196 droplets (filled circle) and the surrounding cytosol (open circle) over time. n = 54 for both droplets and surroundings. Values are means ± s.d. d Schematic diagram of nArgBP2959-1196-3S3D (phospho-mimetic) and nArgBP2959-1196-3S3A (phospho-deficient) mutants. e Representative fluorescence images of COS7 cells transfected with EGFP-nArgBP2959-1196-3S3D and EGFP-nArgBP2959-1196-3S3A. Scale bar: 20 μm. f Representative fluorescence images of COS7 cells cotransfected with EGFP-nArgBP2959-1196-3S3A and CaMKIIα-SBFP2 and treated with ionomycin or KN93 and ionomycin in the presence of 4 mM Ca2+. Scale bar: 20 μm. g Fluorescence images of purified EGFP-nArgBP2959-1196 before treatment with CaMKIIα and ATP. h Enlarged time-lapse images of purified EGFP-nArgBP2959-1196 (yellow squares in g) before and after treatment with CaMKIIα and ATP. Scale bar: 2 μm. i Line scan plots of EGFP-nArgBP2959-1196 (green dashed line in h) fluorescence intensity before and after CaMKIIα and ATP treatment.

