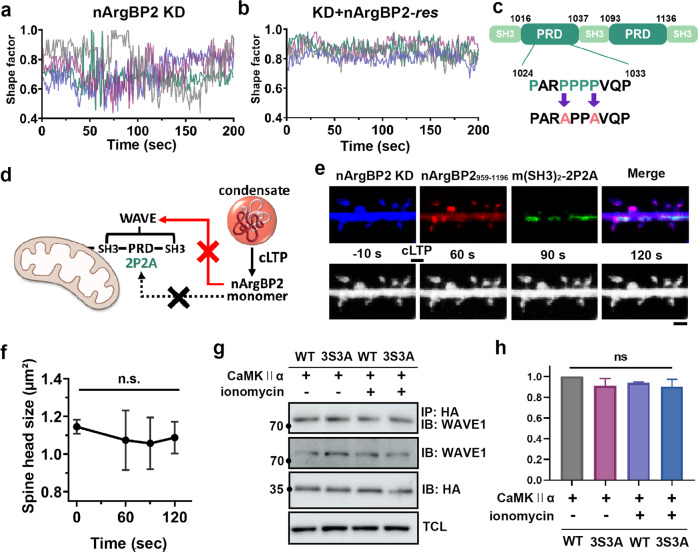
Fig. 6. Spine enlargement caused by nArgBP2 during cLTP is mediated by WAVE1 interaction.
a, b Hippocampal neurons were transfected with shRNA-nArgBP2 with or without nArgBP2-res. The shape factor of dendritic spines calculated from time-lapse recordings during cLTP. Changes in the shape factor, which is the index of spine motility, were analyzed with the form factor (sf = 4πA/p2) plug-in of Fiji. Representative shape factor profiles of nArgBP2 KD and KD + nArgBP2-res spines during cLTP. Each color indicates an individual spine. c Schematic diagram of mito-nArgBP2959-1196-2P2A, in which 2 proline residues (P1027 and P1030) were mutated to alanines (2P2A). d–f Hippocampal neurons were transfected with mTagBFP-tagged shRNA-nArgBP2, mCh-nArgBP2959-1196, and EGFP-mito-nArgBP2959-1110-2P2A to sequester WAVE from the cytosol to the mitochondria. cLTP was induced at DIV 21. d Schematic figure of the “knock-sideway” strategy using mitochondria-targeting SH3-1/2 (nArgBP2959-1110). e Representative fluorescence image of hippocampal neurons and time-lapse images upon cLTP. Scale bar: 2 μm. f The plot of time-dependent changes in single spine head size upon cLTP. One-way ANOVA followed by Tukey’s HSD test. n = 6, n.s., not significant. g, h COS7 cells were transfected with CaMKII and either wild-type or a phospho-deficient mutant (3S3A) of nArgBP2959-1196 and then treated with ionomycin. A coimmunoprecipitation experiment was performed to compare the interaction between nArgBP2 and WAVE1 before and after ionomycin treatment. h The plot of the relative intensity of the coimmunoprecipitation. One-way ANOVA followed by Tukey’s HSD test. n = 3, n.s., not significant.

