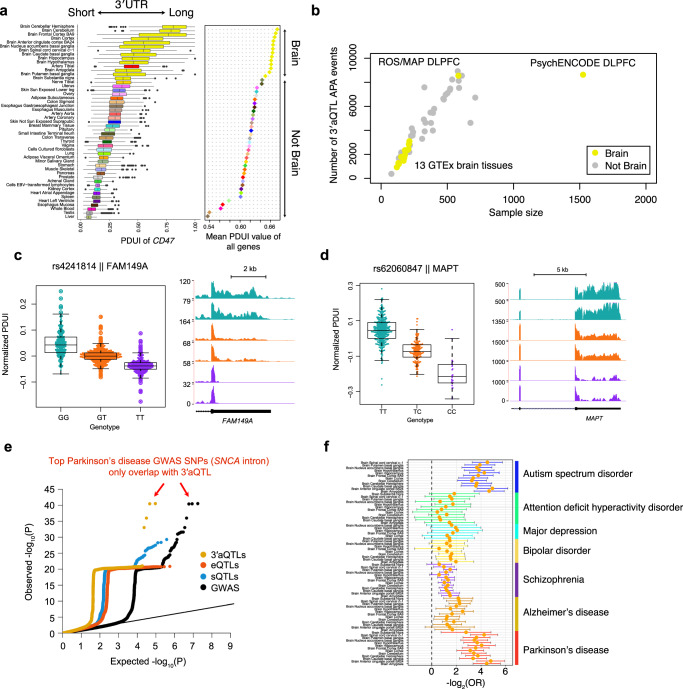
Fig. 2. 3′aQTLs explain a large portion of brain disorder heritability.
a PDUI values of 49 GTEx tissues show that transcripts expressed in the brain tissues have longer 3′UTRs than non-brain tissues. The left panel is the PDUI of an example gene CD47 (n = 15,201 RNA-seq samples). The right panel shows the mean PDUI values for all genes. A higher PDUI value corresponds with longer 3′UTR usage. The color of each tissue corresponds with those used in the GTEx cohort. The center horizontal lines within the plot represent the median values and the boxes are bounded by the 25th and 75th percentile. The whiskers extend to the maximum and minimum values within 1.5 times of the interquartile range. b The number of 3′aQTL APA events highly correlates with the sample size in each tissue. Each dot indicates a tissue type. Yellow and gray dots indicate brain and non-brain tissue types, respectively. c Example of a SNP (rs4241814) that is strongly associated with FAM149A 3′UTR usage in the brain. Left panel: Distribution of the normalized PDUI values for each genotype. Each dot in the box plot represents the normalized PDUI value for one particular sample in the ROS/MAP cohort (n = 579 biologically independent samples). The center horizontal lines within the plot represent the median values and the boxes are bounded by the 25th and 75th percentile. The whiskers extend to the maximum and minimum values within 1.5 times of the interquartile range. Right panel: RNA-seq coverage tracks for the FAM149A 3′UTR. The bottom track shows the RefSeq gene structure. d Similar to (c) but for MAPT in the PsychENCODE cohort (n = 1520 biologically independent samples). The center horizontal lines within the plot represent the median values and the boxes are bounded by the 25th and 75th percentile. The whiskers extend to the maximum and minimum values within 1.5 times of the interquartile range. e Example of Parkinson’s disease quantile–quantile plot (QQ plot) showing the nominal P-values of brain disorder GWAS SNPs, which were binarily annotated by 3′aQTLs (yellow), sQTLs (blue), and eQTLs (light orange) with nominal P-value < 10−5. Each dot represents a GWAS SNP. All Parkinson’s disease GWAS nominal P-values are also shown as controls (black). f Enrichment of 3′aQTLs in seven brain disorder GWAS SNPs (nominal P-value < 10−5) across GTEx brain tissues. 3′aQTLs are calculated based on 2181 RNA-seq samples of brain tissues from the GTEx cohort. Data are presented as mean values ± SEM. OR odds ratio.

