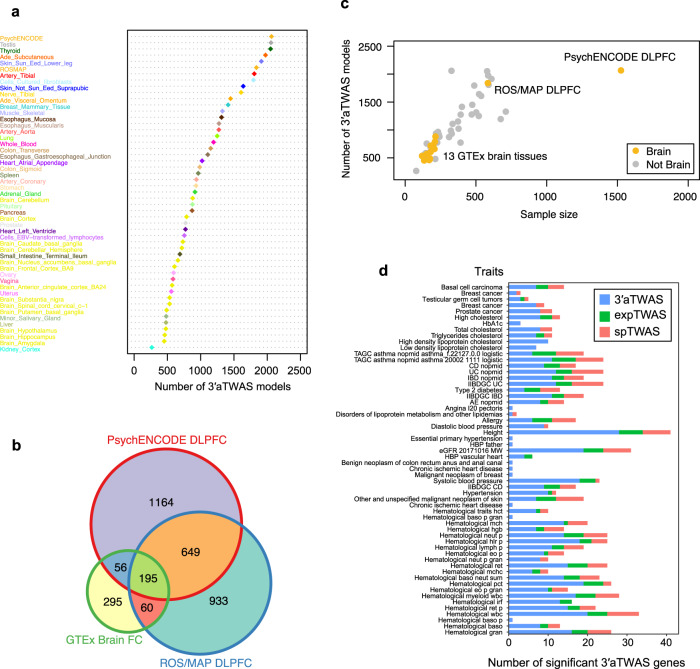
Fig. 3. 3′aTWAS hub across 13 brain tissues and 36 non-brain tissues from ROS/MAP, PsychENCODE, and GTEx cohorts.
a Number of 3′aTWAS models across each tissue from ROS/MAP, PsychENCODE, and GTEx cohorts. DLPFC, dorsolateral prefrontal cortex. b Venn diagram showing the overlap between the number of 3′aTWAS models in ROS/MAP DLPFC, PsychENCODE DLPFC, and GTEx Brain frontal cortex (FC) tissues. c The number of 3′aTWAS models is highly correlated with the sample size in each tissue. Each dot indicates a tissue type. Yellow and gray dots indicate brain and non-brain tissue types, respectively. d A majority of human diseases of 3′aTWAS genes are not expression TWAS or splicing TWAS genes. 3′aTWAS specific genes are shown in blue. Overlap between 3′aTWAS and expression TWAS genes is shown in green. Overlap between 3′aTWAS and splicing TWAS genes is shown in red.

