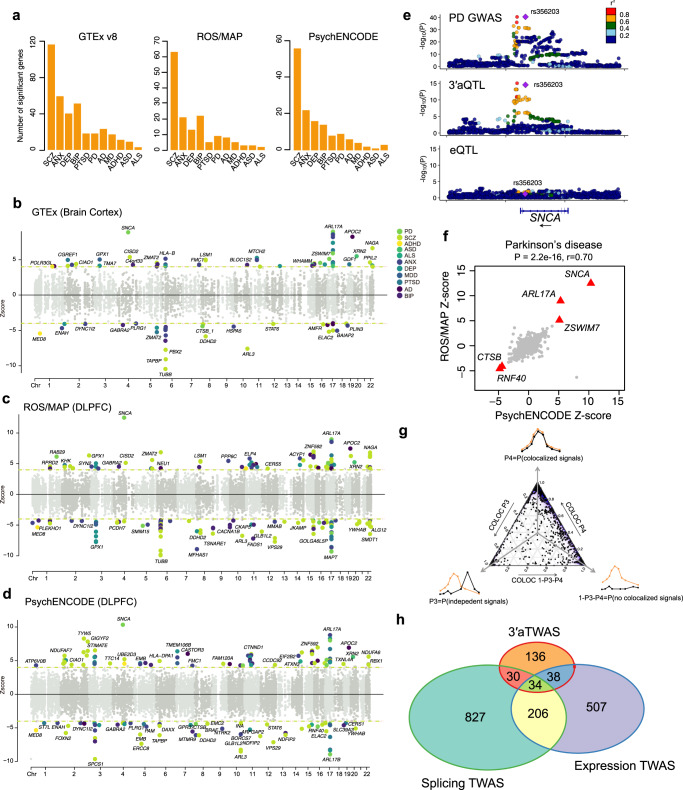
Fig. 4. 3′aTWAS for 11 brain disorders.
a Bar plots show the number of 3′aTWAS significant genes (FDR < 0.05) for 11 brain disorders in 13 GTEx-derived brain tissues, ROS/MAP DLPFC, and PsychENCODE DLPFC. b–d Manhattan plots of 3′aTWAS results in 11 brain disorders using prediction models from GTEx Brain Cortex (b), ROS/MAP DLPFC (c), and PsychENCODE DLPFC (d). Each point represents the Z-score of a single 3′aTWAS association. Colored points represent significant associations with brain disorders at FDR < 0.05, with each of the 11 colors representing 1 of 11 different brain disorders. e Aligned Manhattan plots of Parkinson’s disease GWAS, 3′aQTLs, and eQTLs at the SNCA locus. SNPs are colored by LD (r2). f Parkinson’s disease was used as an example to assess whether similar results were observed from different 3′aTWAS prediction models built from an independent reference panel. Parkinson’s disease 3′aTWAS Z-scores in ROS/MAP and PsychENCODE are highly correlated (two-tailed Pearson correlation P-value = 2.2e−16, r = 0.70). Red triangles represent replicate genes in Parkinson’s disease which are 3′aTWAS significant and have consistent directions when using ROS/MAP and PsychENCODE as reference panels. g A ternary plot represents the colocalization probabilities for 3′aTWAS significant associations. h Venn diagram shows the overlap of 3′aTWAS significant genes (FDR < 0.05) for 11 brain disorders with expression and splicing TWAS.

