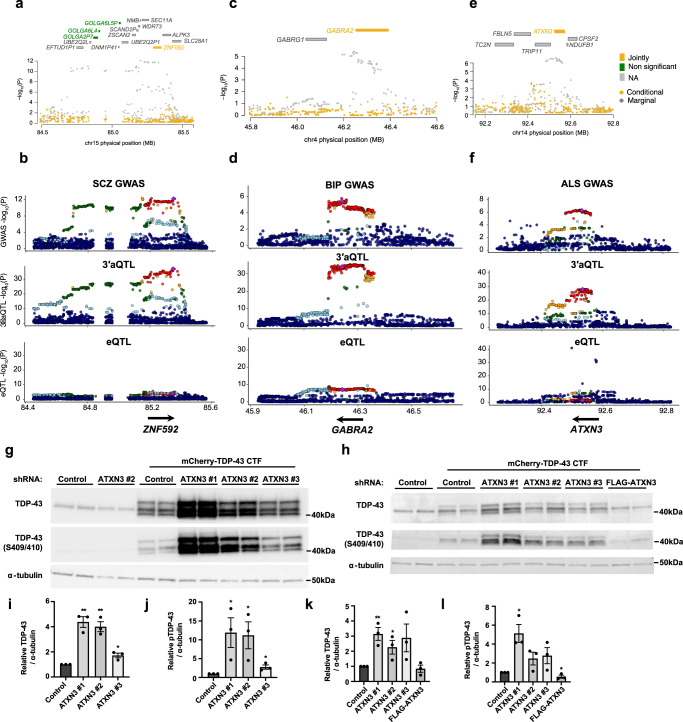
Fig. 5. 3′aTWAS identifies new APA-linked susceptibility genes in brain disorders.
a Regional association plot. SCZ GWAS signal at the ZNF592 locus (gray) and GWAS signal after removing the effects of ZNF592 3′UTR usage (yellow). This analysis shows that the association is largely explained by ZNF592 3′UTR usage. b Aligned Manhattan plots of SCZ GWAS, 3′aQTLs, and eQTLs at the ZNF592 locus. SNPs are colored by LD (r2). c Similar to (a) for the GABRA2 locus in BIP. d Similar to (b) for the GABRA2 locus in BIP. e Similar to (a) for the ATXN3 locus in ALS. f Similar to (b) for the ATXN3 locus in ALS. g-h Western analysis of HEK293T cells (g) and SH-SY5Y cells (h) transfected with mCherry-tagged TDP-43 CTF (aa 208–414) and shRNAs for 48 h. Note: Multiple bands reflect distinct cleavage products. TDP-43 was detected using an antibody that recognizes a C-terminal epitope. i Quantification of total TDP-43 in HEK293T cells transfected with ATXN3 shRNA #1 (p = 0.0013), #2 (p = 0.0016), or #3 (p = 0.0182) relative to shRNA control. j Quantification of pTDP-43 in HEK293T cells transfected with ATXN3 shRNA #1 (p = 0.0483), #2 (p = 0.0460), or #3 (p = 0.0351) relative to shRNA control. k Quantification of total TDP-43 in SH-SY5Y cells transfected with ATXN3 shRNA #1 (p = 0.0073), #2 (0.0496), #3 (0.1098), or FLAG-ATXN3 (p = 0.5485) relative to shRNA control. l Quantification of pTDP-43 in SH-SY5Y cells transfected with ATXN3 shRNA #1 (p = 0.0121), #2 (p = 0.0961), #3 (p = 0.01050), or FLAG-ATXN3 (p = 0.0488) relative to shRNA control. Each experiment was repeated n = 3 times. Data are presented as mean values ± SEM. Statistical significance was determined by an unpaired two-tailed t-test between each condition and the shRNA control. * represents p < 0.05. ** represents p < 0.01.

