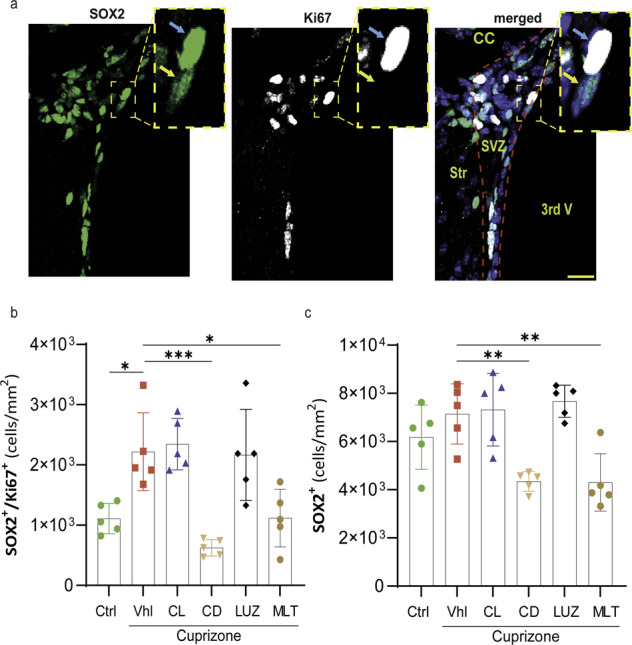
Fig. 4. Quantification of NSPC responses to demyelination and treatment in the SVZ.

a Fluorescent staining of the NSPC marker SOX2, the proliferation marker Ki67, and DAPI. The blue arrow indicates proliferative SOX2, and yellow shows quiescent NSPCs. b Quantification of the number of proliferative NSPCs (SOX2 + /Ki67 + ). c Quantification of the number of NSPCs (SOX2 + ), which included both quiescent and proliferative NSPCs. All quantifications were performed in the SVZ region on 25 μm-thick sections (n = 5 mice/group; 3 slides per mouse). Significance is indicated by ∗p < 0.05, ∗∗p < 0.01, and ∗∗∗p < 0.001. Scale bars, 20 μm.
