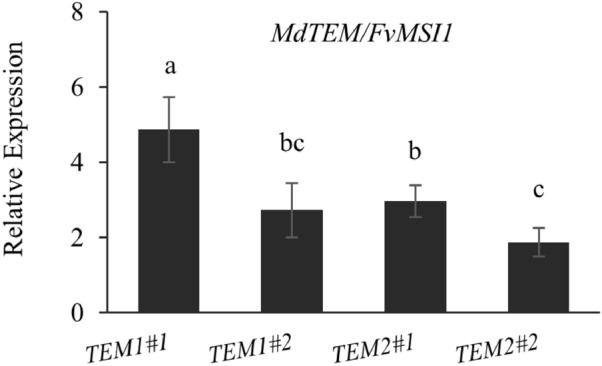
Figure 6.

Relative expression of MdTEM1 and MdTEM2 genes in overexpressing 35S::MdTEM1 and 35S::MdTEM2 lines. RNA was measured using NanoDrop and 1 µg of RNA was used for each sample. Samples were collected at ZT 8 from fully expanded young leaves of plants in the growth chamber at 25 °C under 16/8 h. light/dark photoperiod. Error bars indicate standard errors. Means were compared by LSD test and different letters show a significant difference at p ≤ 0.05.
