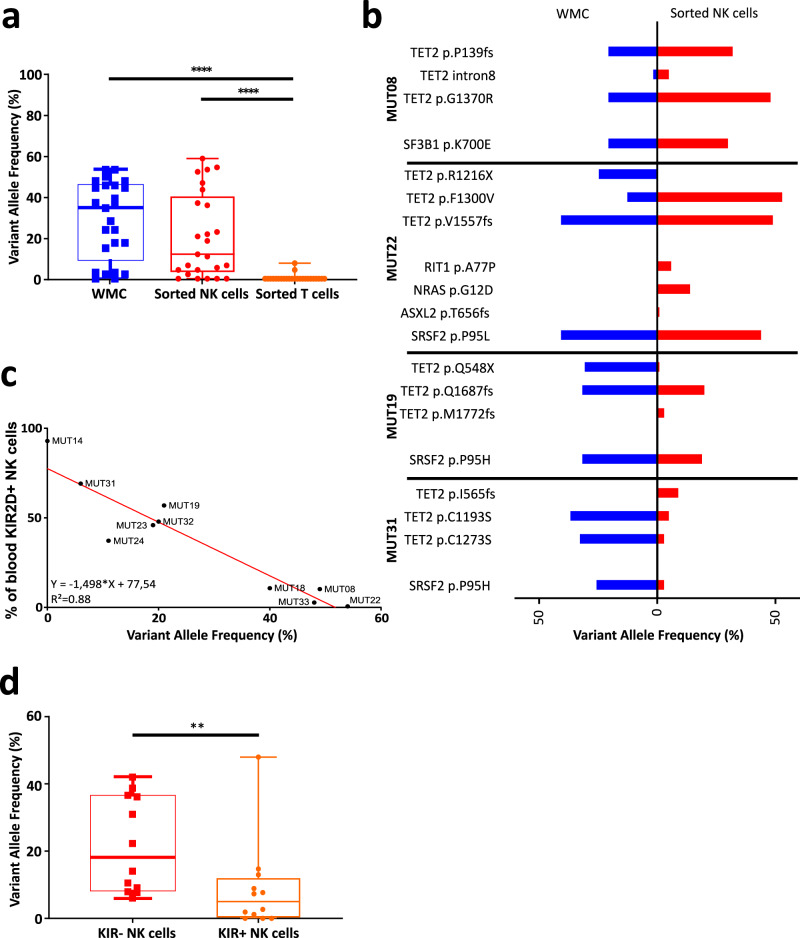
Fig. 2. TET2 mutations identified in bulk cells of MDS patients at diagnosis are also observed in NK cells and correlate with KIR2D expression.
a The percentage of Variant Allele Frequency (VAF) for the mutations of TET2 observed in the white mononuclear cells (WMC) and in sorted NK/T cells at diagnosis of TET2MUT MDS/CMML patients (n = 10) was evaluated by NGS analysis (with a range from 1 to 4 mutations per patient). Data are represented as box-and-whisker plots (minimum VAF, 25% percentile, median, 75% percentile, and maximum VAF respectively for WMC: 0%, 11.25%, 32.5%, 42.5%, 49%; for NK cells: 0%, 3.5%, 14%, 35.5%, 54%; and for T cells: 0%, 0%, 0%, 0%, 7%). Nonparametric two-sided Wilcoxon matched-pairs signed rank test was used to determine statistical significance. ****p < 0.0001. b VAF (%) of the different mutations detected in the WMC at diagnosis (blue) and in sorted NK cells (red) in 4 patients (MUT08, MUT22, MUT19, MUT31; see Supplementary Table 6 for more information). c Correlation curve between the percentage of KIR2D+ NK cells and the TET2 VAF (%) in blood NK cells from the MDS/CMML patients analyzed in (a). Linear regression was calculated, r = 0.88, p < 0.0001. d The VAF percentage in the WMC and in sorted KIR+ and KIR− NK cells at diagnosis from TET2MUT MDS/CMML patients (n = 5, range from 1 to 4 mutations per patient) was evaluated by NGS analysis. Data are represented as box-and-whisker plots (minimum VAF, 25% percentile, median, 75% percentile, and maximum VAF respectively for KIR− NK cells: 6.1%, 8.3%, 18.2%, 36.5%, 42.1%; and KIR+ NK cells: 0%, 1.2%, 7.3%, 13%, 48%). Statistics were calculated with a two-sided nonparametric Wilcoxon matched-pairs signed rank test. *p = 0.0186. Source data are provided as a Source Data file.

