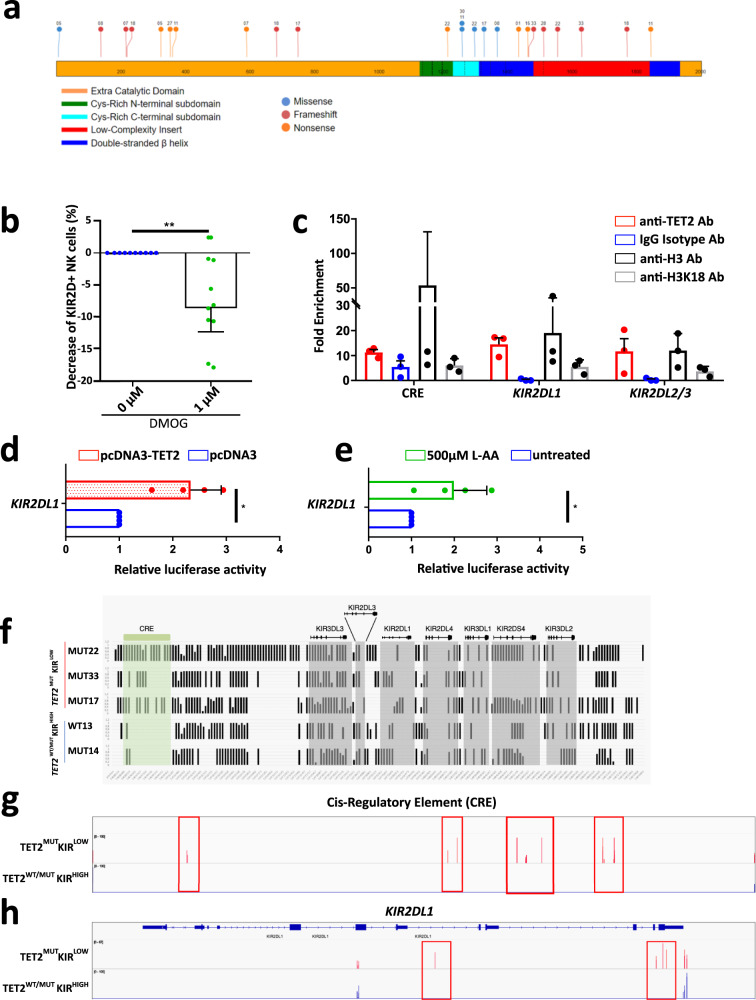
Fig. 3. TET2 regulates KIR expression on NK cells through its binding onto and regulating methylation of the KIR locus.
a TET2 mutational landscape in the 13 TET2MUT patients with KIR2D expression below 25% established with the St Jude protein paint software (https://proteinpaint.stjude.org/). Mutations were classified as Missense (blue), Frameshift (red), and Nonsense (orange). Numbers associated with each mutation designed patients (Supplementary Data 1). b Percentage of KIR2D+ NK cells after 5 days of in vitro treatment with 1 µM DMOG (n = 10). DMSO alone was used as a control. One dot represents one PBMC sample. Nonparametric two-sided Wilcoxon matched-pairs signed rank test was used to determine statistical significance. **p = 0.0059. Data are presented as median and interquartile range. c Fold enrichment of sequences specific for the Cis-regulatory element (CRE), KIR2DL1 promoter, and KIR2DL2/3 promoter analyzed in sorted NK cells by ChIP-qPCR with TET2, H3 or H3K18 specific mAbs or IgG isotype control. Means ± SD is shown (n = 3). Each dot represents one independent experiment. d Luciferase activity in HEK293T cells co-transfected with a TET2 full-length plasmid or an empty plasmid as control, and the luciferase-reporter construct containing the region (−147 + 60) of the KIR2DL1 promoter. Means ± SD is shown (n = 4). Each dot represents one independent experiment. Nonparametric two-sided Wilcoxon matched-pairs signed rank test was used to determine statistical significance. *p = 0.0286. e Jurkat cells transfected with the KIR2DL1 promoter-luciferase reporter plasmid were treated with 500 µM of L-AA for 16 h and analyzed by detecting luminescence signal. Means ± SD is shown (n = 4). Each dot represents one independent experiment. Nonparametric two-sided Wilcoxon matched-pairs signed rank test was used to determine statistical significance. *p = 0.0286. f RRBS DNA methylation profiles of the extended KIR locus of NK cells with low or high KIR2D expression. Each graph represents the DNA methylation profile of sorted NK cells from blood samples of 5 patients; vertical bars represent the percentage of DNA methylation at the CpG position. CRE and KIR genes were highlighted in green and gray respectively. g and h IGV (Integrative Genomics Viewer) view of CpG read signals corresponding to DNA methylation in NK cells, based on the high (TET2WT/MUTKIRHIGH, in blue bars) and low (TET2MUTKIRLOW, in red bars) KIR expression. Genome profiles at the CRE region (g) and the KIR2DL1 gene (h) loci showed variation in the DNA methylation pattern between the two groups of patient NK cells. Red peaks/boxes show significant differences in the DNA methylation levels at particular CpG positions of these specific loci. Source data are provided as a Source Data file.

