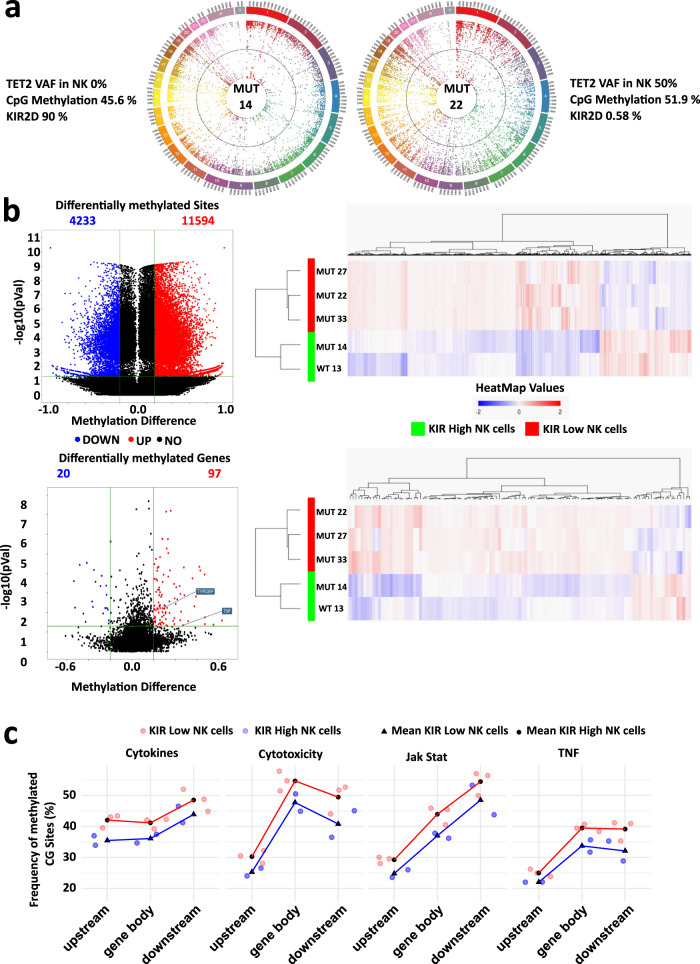
Fig. 4. Loss of TET2 leads to DNA hypermethylation and decreases key gene expression for NK cell function.
a Circos plots showing whole-genome CpG methylation status in patient MUT14 characterized by the absence of TET2 mutations in NK cells and a high expression of KIR2D, and in patient MUT22 with a VAF of 50% for the TET2 mutation [NM_001127208:exon11:c,4669_4672del:p.V1557fs] and a very low expression of KIR2D in NK cells. b Volcano plots and heatmaps showed the overall increase of global DNA methylation levels reported after RRBS analysis, in the TET2MUTKIRLOW (n = 3) vs. TET2WT/MUTKIRHIGH (n = 2) NK cells. Heatmaps depicted supervised clustering of the significantly modified sited genes between patients’ subgroups. Blue dots/bars show the hypomethylated CpG/genes whereas red dots/bars show the hypermethylated ones (methylation difference ≥20%, unadjusted p-value ≤ 0.05). Top panel shows the differentially methylated CpG sites. Bottom panel shows the differentially methylated genes. c GO-enrichment analysis on the differentially methylated genes in the TET2MUTKIRLOW and TET2WT/MUTKIRHIGH NK cells. Percentages of methylated CpG sites were calculated in gene bodies and 10 kb upstream or downstream of the gene of interest in TET2MUTKIRLOW and TET2WT/MUTKIRHIGH NK cells (in red and blue, respectively) and aggregated across all genes of a given KEGG pathway for each sample. Pathways of interest shown are the cytokine–cytokine receptor interactions (KEGG reference hsa04060), the JAK-STAT signaling pathway (hsa04630), the TNF signaling pathway (hsa04668), and the NK cell-mediated cytotoxicity pathway (hsa04650). Source data are provided as a Source Data file.

