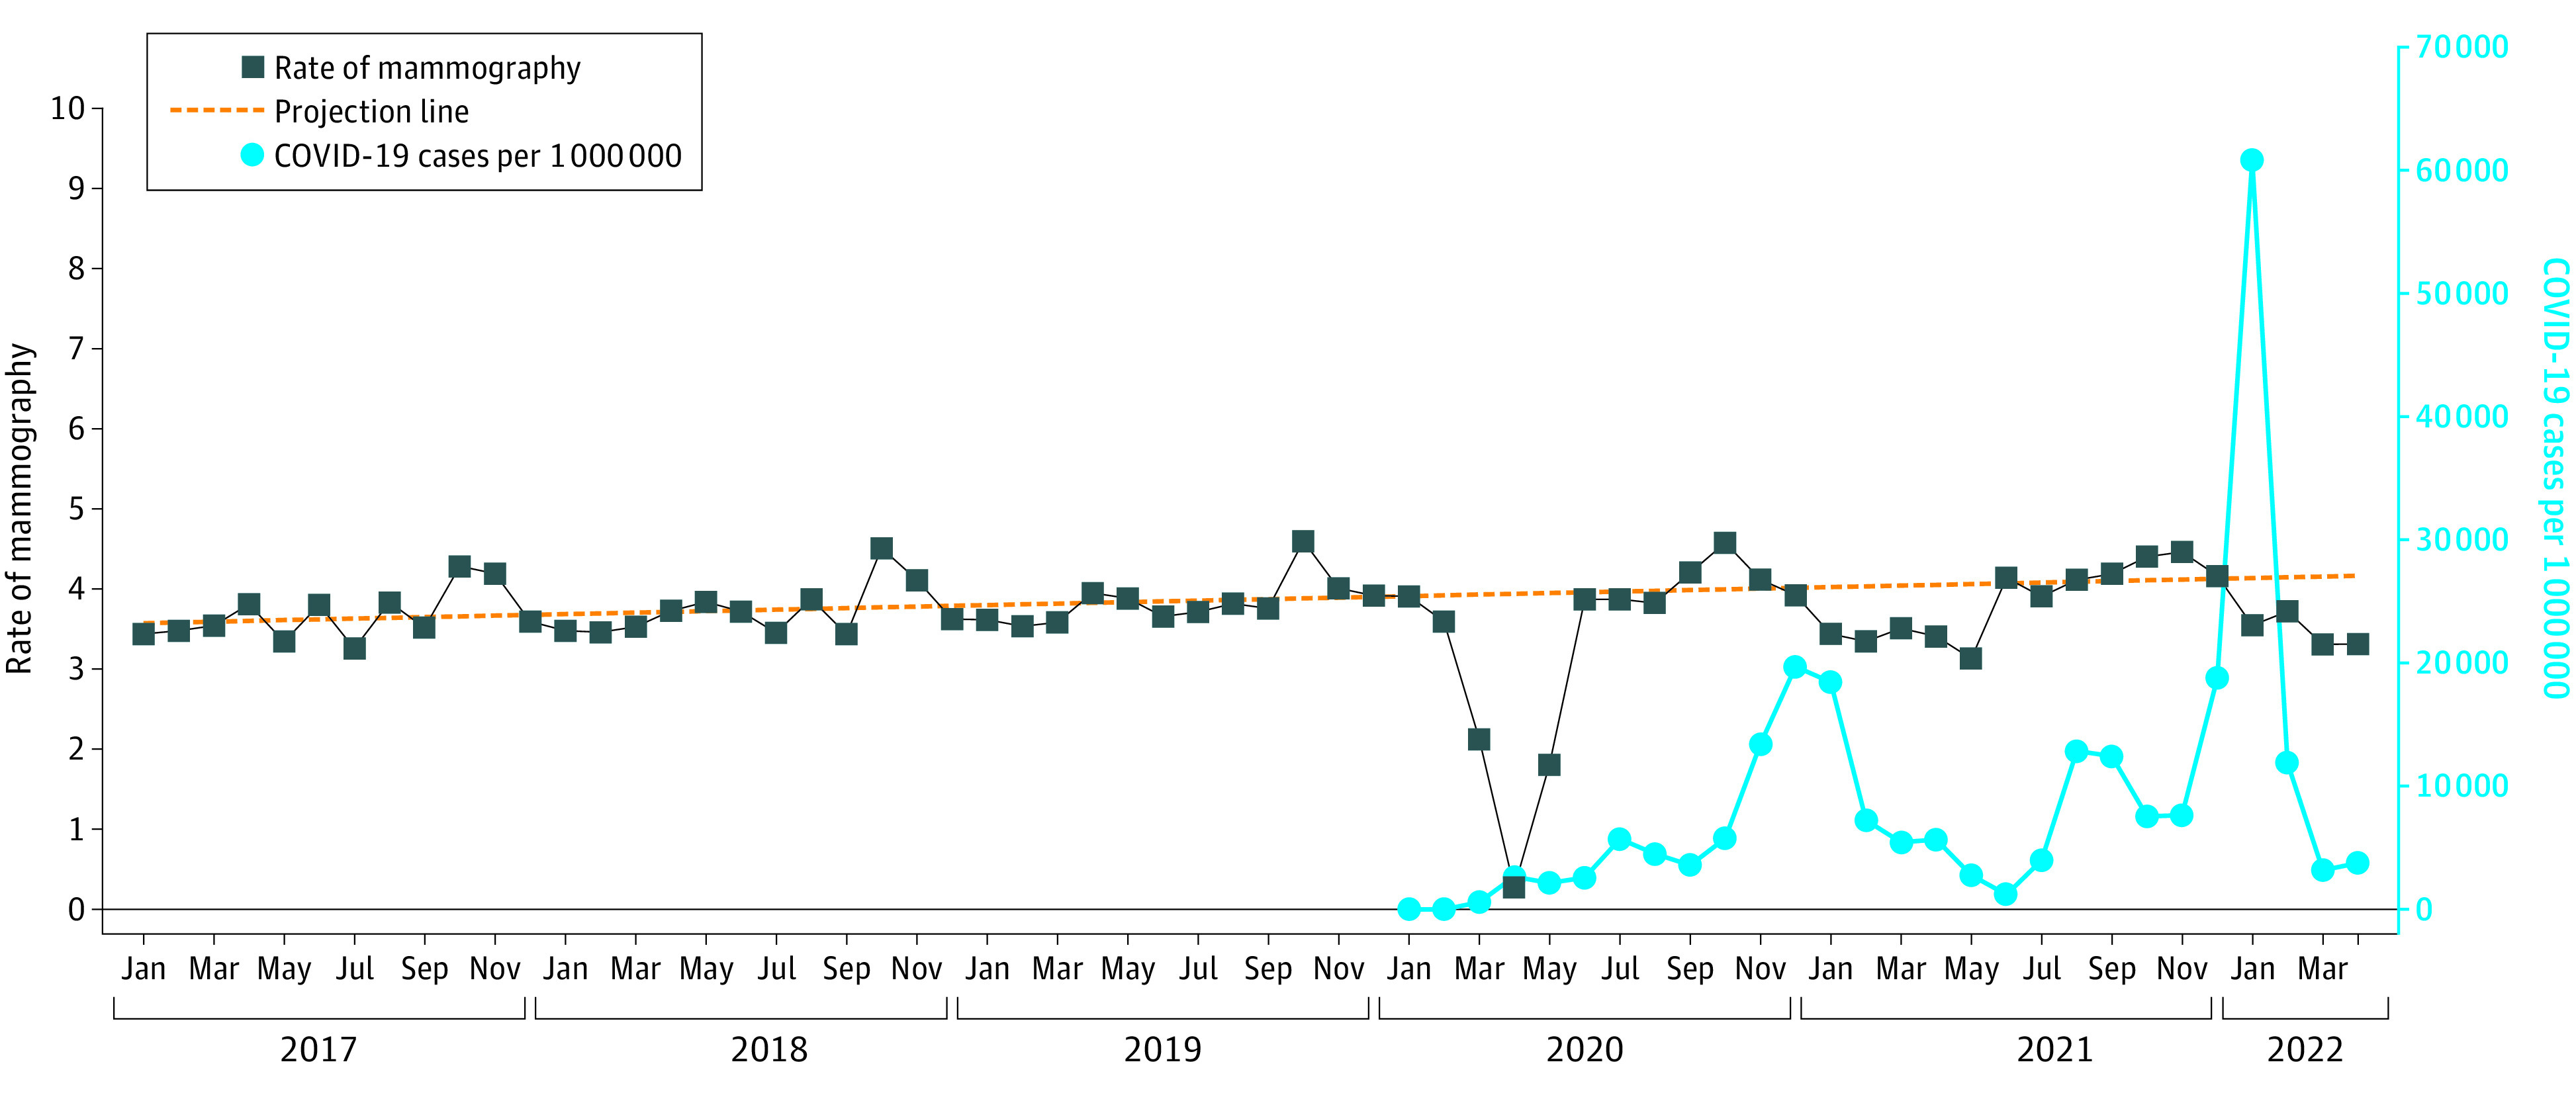
Figure 1. Rates of Monthly Mammography Screening From January 2017 Through July 2022 for Women Aged 50 to 74 Years With Fee-for-Service Medicare.

Monthly national COVID-19 infection rates from January 2020 through July 2022 are also shown. The monthly rates were adjusted to reflect 30 days per month. The dotted prediction line was generated from the 38 months from January 2019 through February 2020. The slope from January 2017 to February 2020 was 0.00838% (95% CI, −0.0015% to 0.01830%) per month, not significantly different from 0. There were no significant changes in slope over that same period by joinpoint analyses. There were increases in rates each October, corresponding to Breast Cancer Awareness Month. After the initial fall in rates in March, April, and May of 2020, there were periodic decreases in screening rates, corresponding to increases in national COVID-19 case rates.
