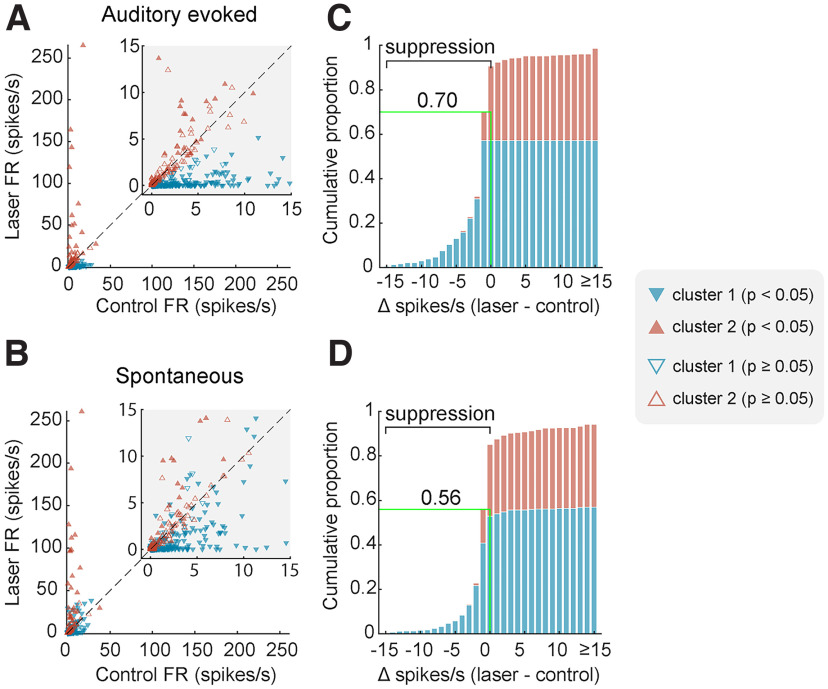
Figure 4.
Optogenetic inactivation of auditory cortical activity. A, B, Scatterplots of firing rate with and without laser. C, D, Cumulative histograms of change in firing rate with laser light delivery. Plots show firing rate measured during (A, C) or before (B, D) sound presentation for each unit, colored by cluster and filled if the change in firing rate between laser conditions was significant (Wilcoxon signed-rank, p < 0.05). Green lines/labels on cumulative histograms mark the proportion of units (across all clusters) in which laser presentation suppressed spiking activity.

