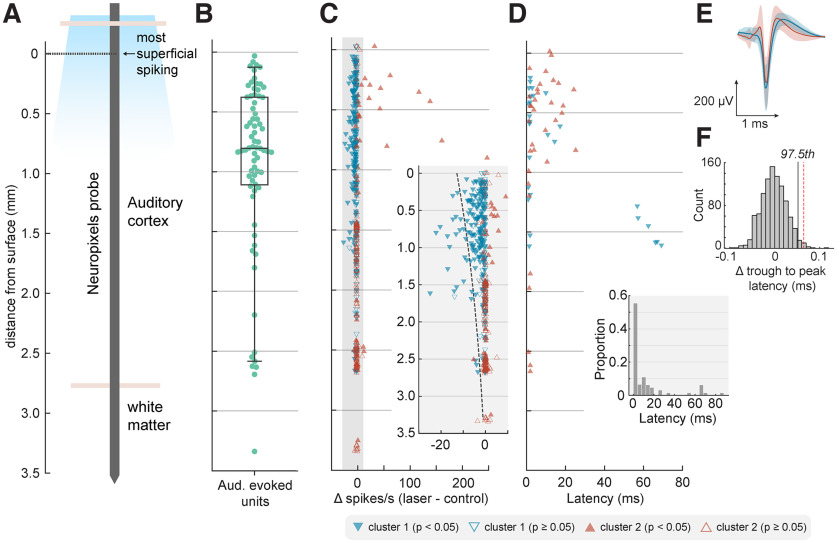
Figure 5.
Depth-dependent optogenetic suppression. A, Schematic of probe displaying approximate anatomic locations in reference to surface, defined as the most superficial depth at which spiking was observed. B, The location of auditory evoked units (n = 72) as a function of cortical depth from surface with boxplot showing quartiles with whiskers showing the 95th percentiles. C, Change in firing rate with light delivery as a function of cortical depth from surface. Inset, Magnified gray region with dotted line indicating predictions from fitted Poisson mixed-model. D, Latency of significant change in firing rate with light delivery as a function of depth. C, D, Marker color and shape indicate cluster grouping identified via K-means clustering, as in Figure 4. E, Spike shapes of well-isolated single units of Cluster 1 (blue, n = 80 SUs) and Cluster 2 (red, n = 20 SUs) recorded within 1.598 mm of the surface. Data are shown as mean ± SD. F, Difference in trough-to-peak latency of each mean waveform (Cluster 1 – Cluster 2) for observed data (red dashed line, difference = 0.0648 ms) or when randomly shuffling clusters labels (histogram, n = 1000 iterations) during permutation testing (97.5th percentile, black line).

