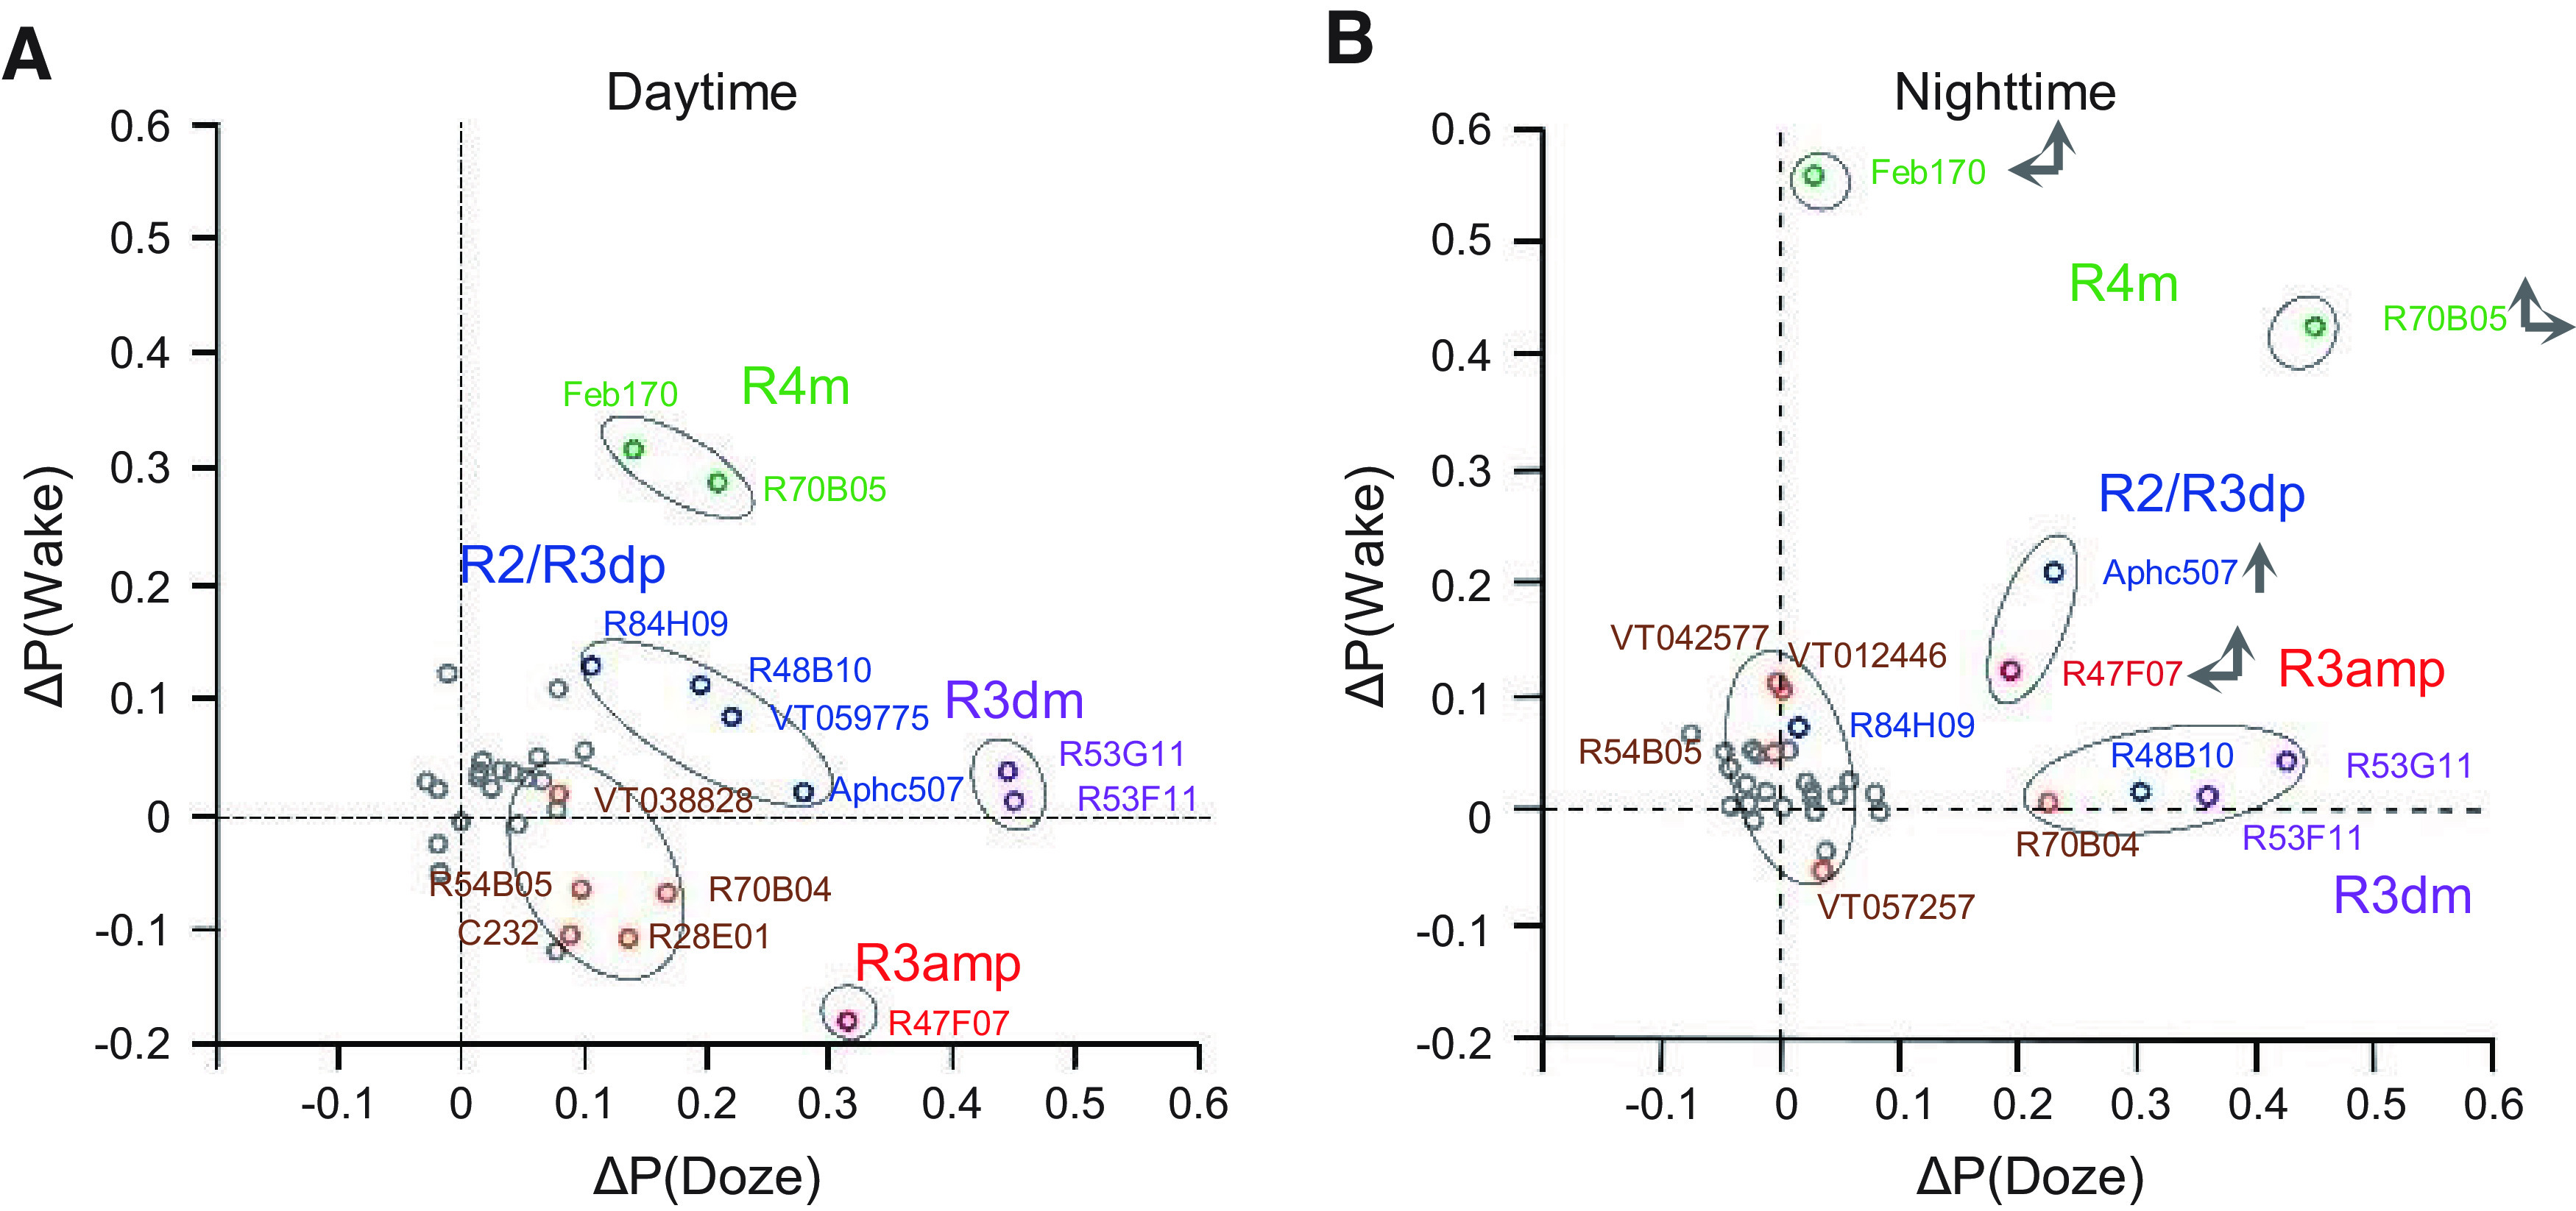
Figure 5.

Association of changes in arousal and sleep drive with GAL4+ groups of ring neurons. Mixed Gaussian model cluster analysis for drivers have similar patterns during the daytime (A) and at night (B). Gray dots represent activation did not show significance in P(wake)/P(doze) analysis. Green dots represent increase in both P(wake) and P(doze). Blue dots represent mild increase in both P(wake) and P(doze). Brown dots represent weak increase in both P(wake) and P(doze). Purple dots represent increase only in P(doze). Red dots represent increase in P(doze) and decrease in P(wake). Vertical and horizontal arrows in nighttime panel represent shifts in location of P(doze) and P(wake) compared with the daytime.
