Figure 1.

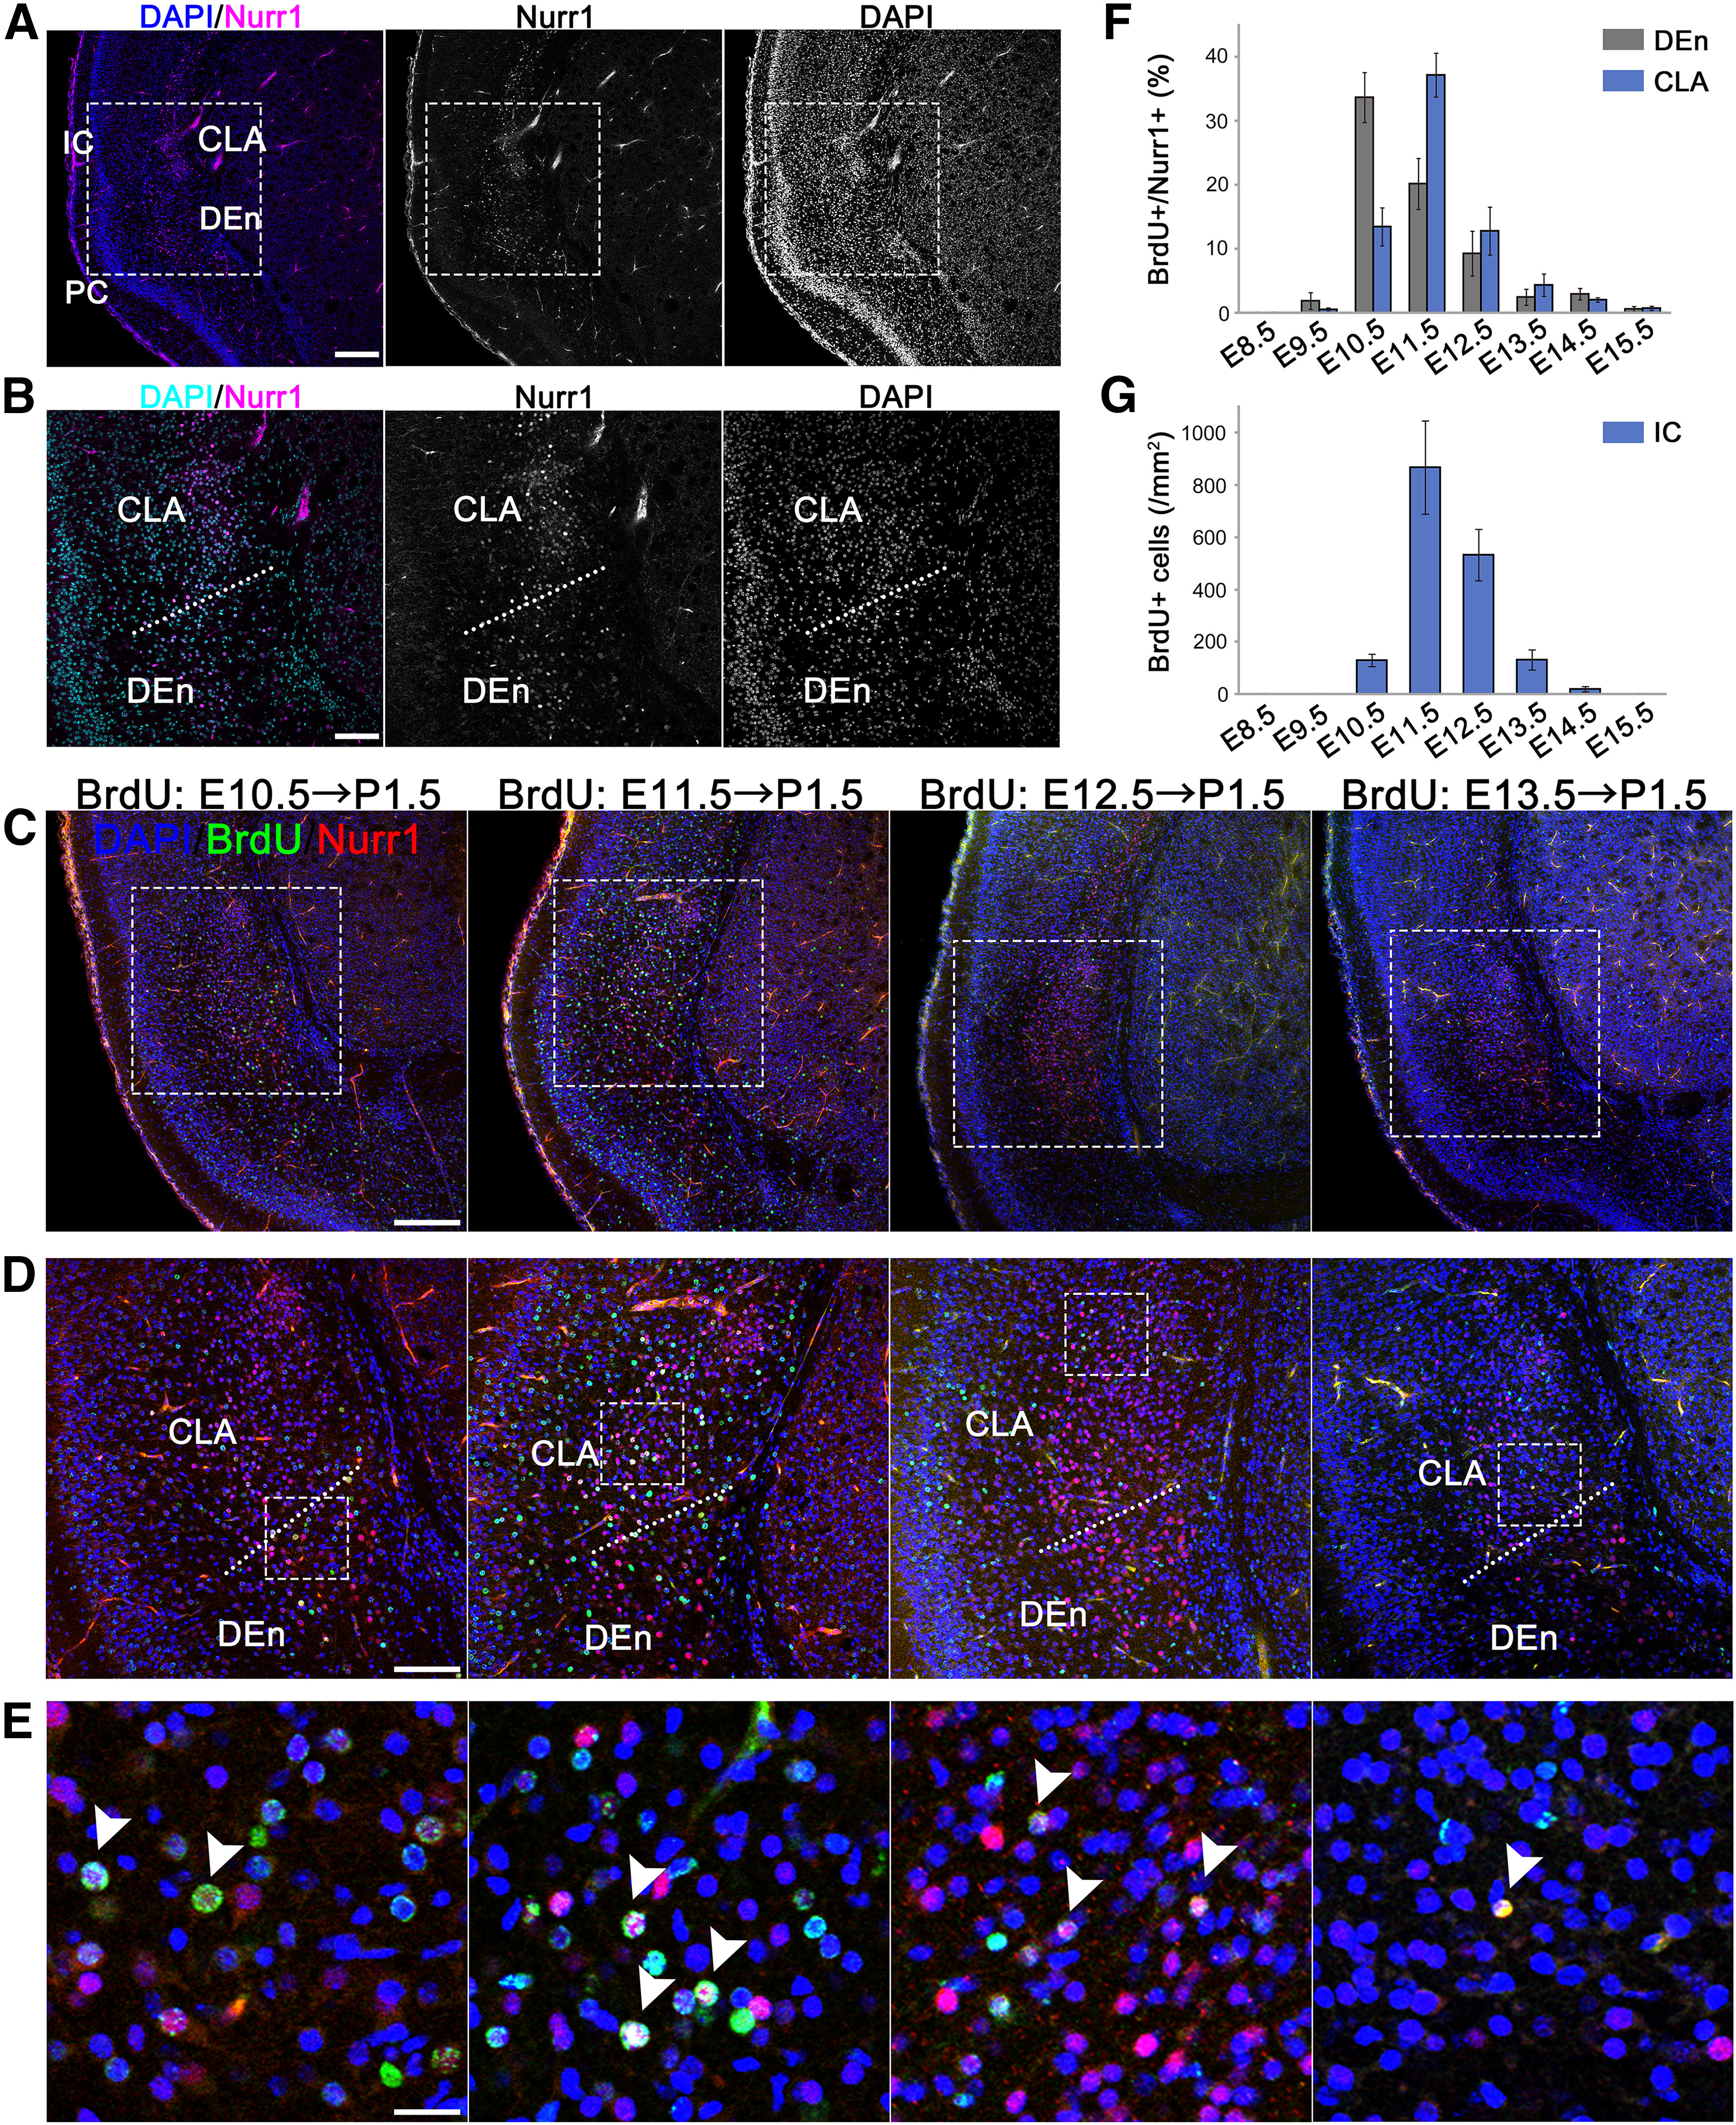
Mapping of the CLA and DEn cell birthdate analyzed by BrdU incorporation. BrdU was injected into pregnant mice at E8.5, 9.5, 10.5, 11.5, 12.5, 13.5, 14.5, or 15.5. The nuclei were labeled with DAPI (blue in A, C–E; cyan in B). A, A coronal section at the medial level. In order to identify the CLA and DEn, we performed immunohistochemistry for Nurr1 (magenta), a molecular marker of the CLA and DEn. IC, Insular cortex; PC, piriform cortex. B, Higher magnification of A. C, Representative images of the CLA and DEn slices showing BrdU-labeled cells (green) generated between E10.5 and E13.5 and analyzed at P1.5. The CLA and DEn were labeled with Nurr1 (red). D, E, Higher magnification of the labeled-boxed areas in C and D, respectively. BrdU-labeled cells of the CLA or DEn were indicated (white arrowheads). F, Ratios of BrdU-labeled Nurr1-positive cells among total Nurr1-positive cells in the CLA and DEn at P1.5. CLA was considered to be Nurr1-positive cells above the CLA/DEn dividing line and included both the ventral and dorsal CLA. Total numbers of cells counted: 9265. Data are mean ± SE of the data obtained in seven different brains from three litters (E8.5, E9.5, E13.5, E14.5, and E15.5) or nine brains derived from four litters (E10.5, E11.5, and E12.5). G, Cell density of BrdU-positive cells in the insular cortex at P1.5. Total number of cells counted: 870. Data are mean ± SE of the data obtained from the seven different brains derived from three litters. Scale bars: A, 250 µm; B, 125 µm; C, 200 µm; D, 100 µm; E, 20 µm. Top, Dorsal side. Bottom, Ventral side. Left, Superficial (lateral) side. Right, Deep (medial) side.
