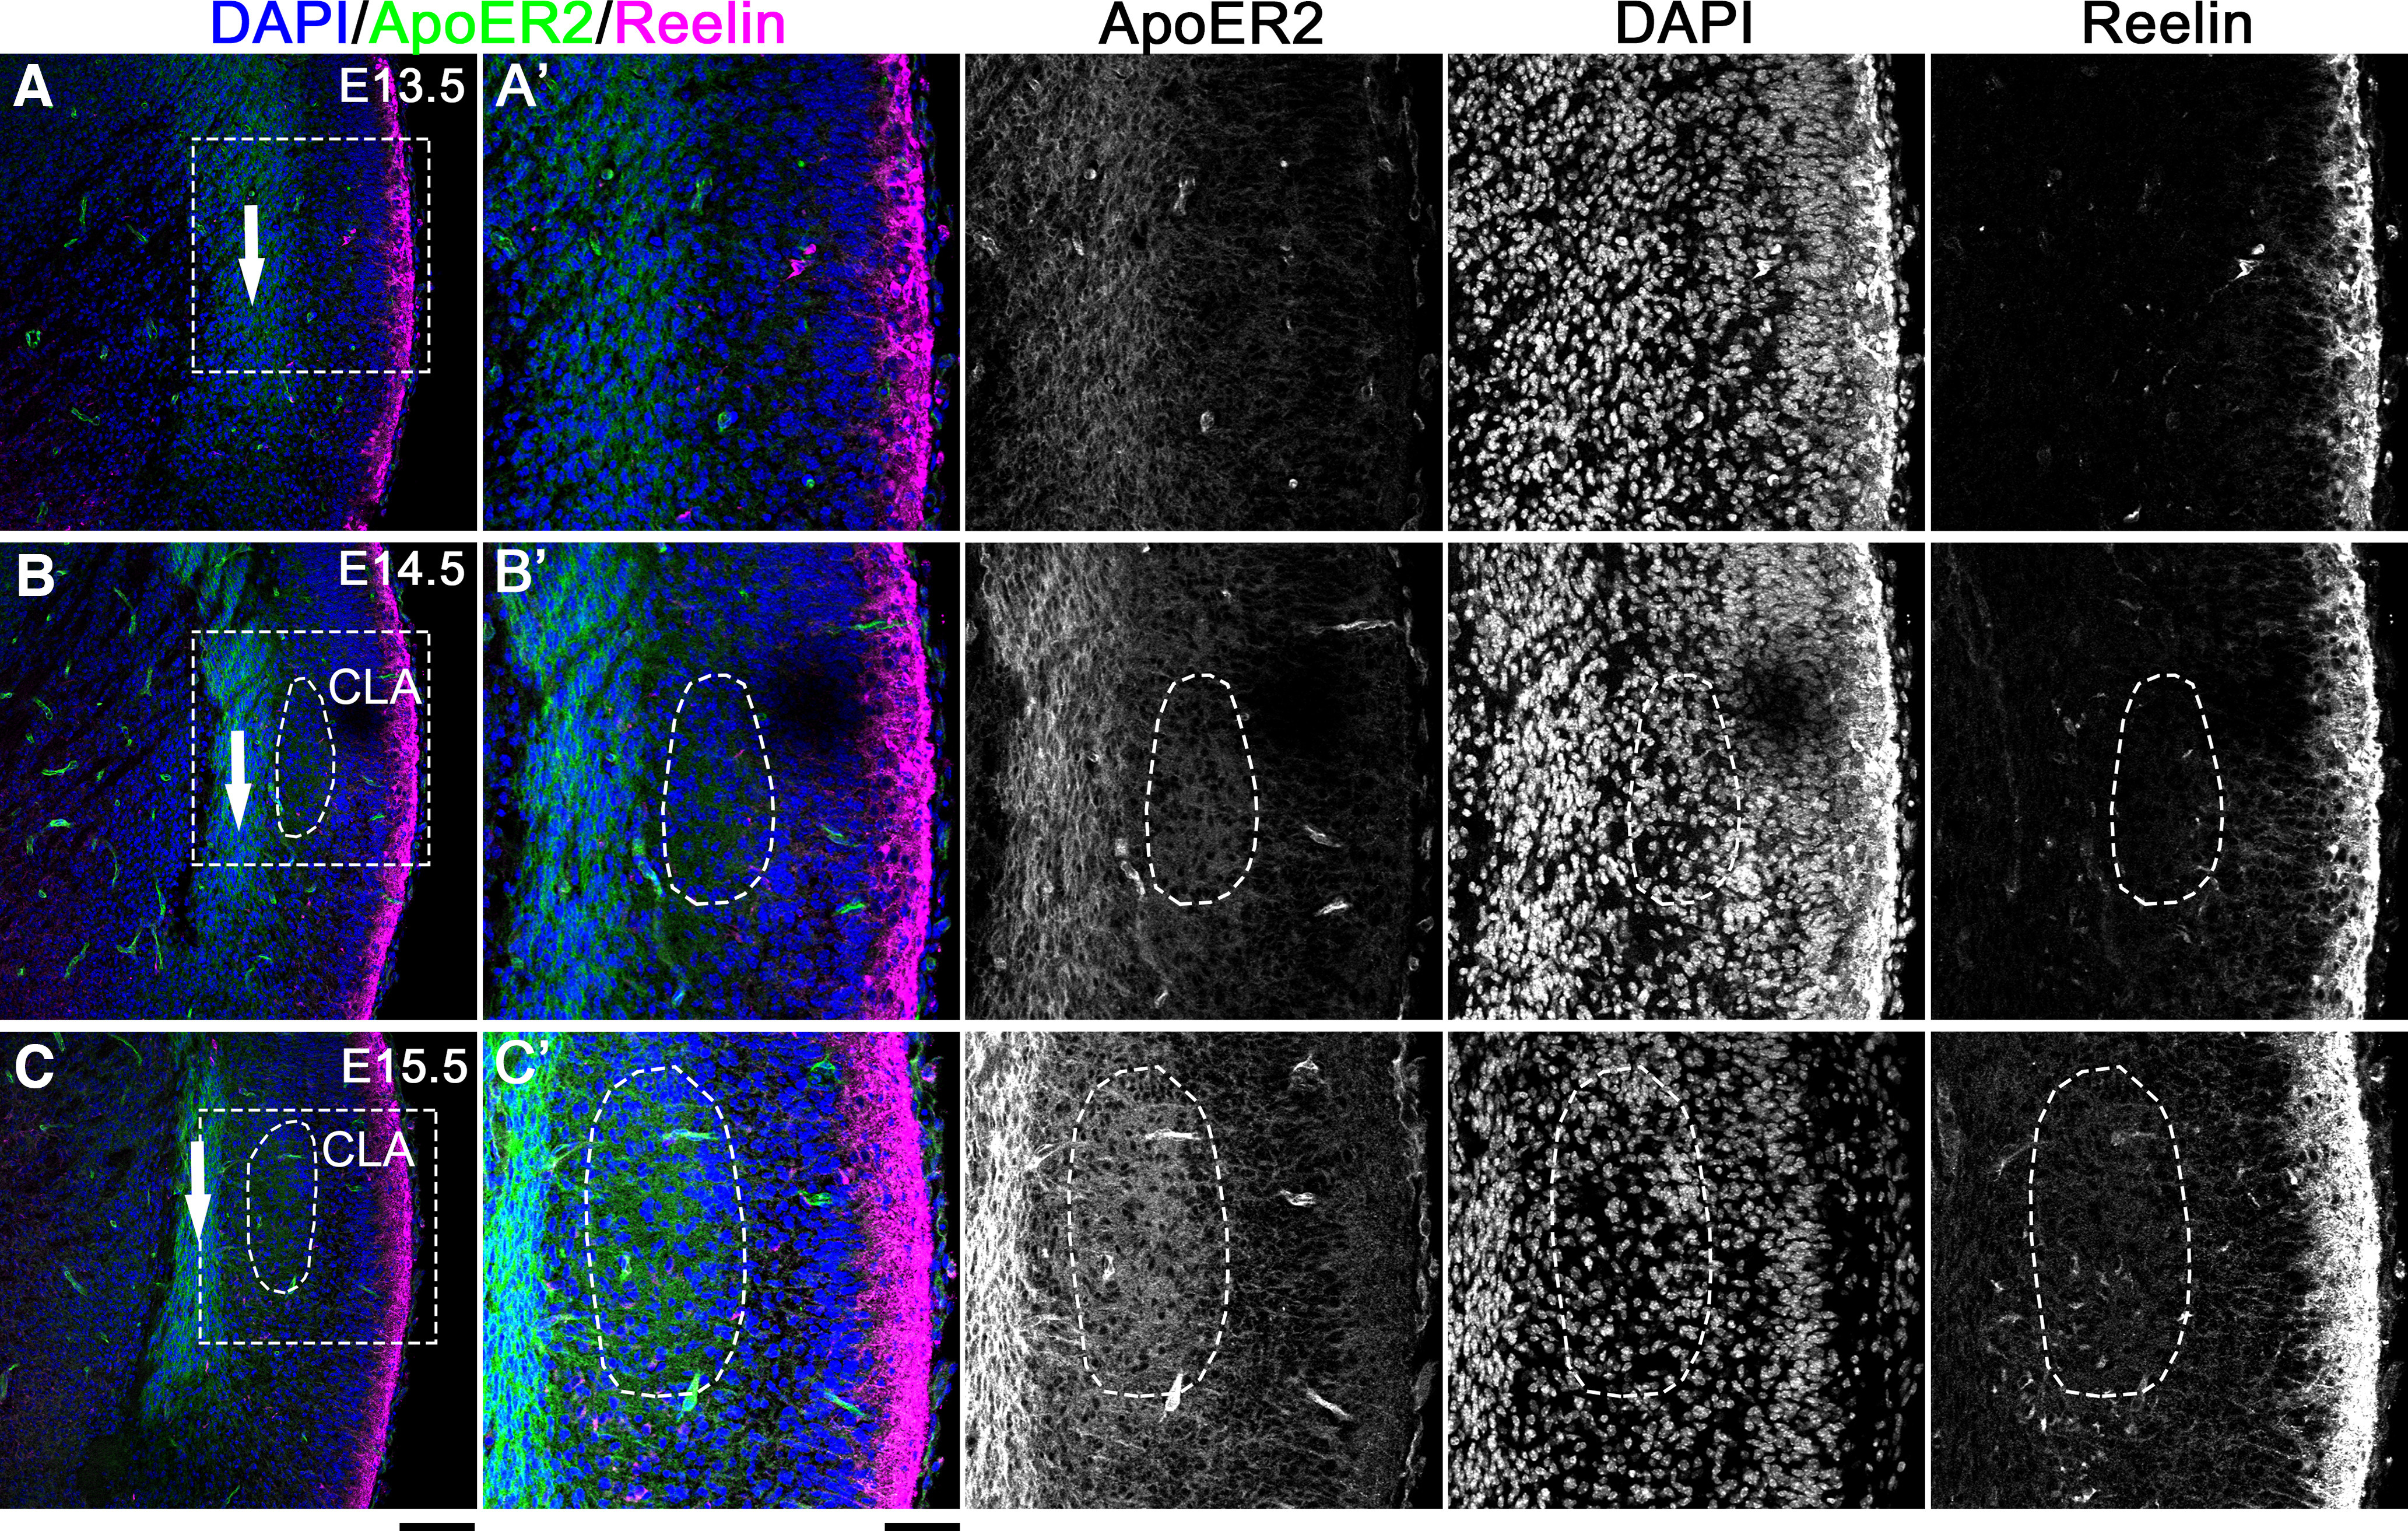
Figure 6.

The CLA expressed ApoER2 during development. A–C, Brains were immunostained with anti-ApoER2 (green) and anti-Reelin (magenta) antibodies at E13.5 (A), E14.5 (B), and E15.5 (C). White arrows indicate cortical migratory stream. The nuclei were labeled with DAPI (blue). A′–C′, Higher magnifications of the labeled-boxed area in A–C, respectively. Scale bars: A–C, 200 µm; A′–C′, 100 µm. Left, Deep (medial) side. Right, Superficial (lateral) side. Top, Dorsal side. Bottom, Ventral side.
