Fig. 1.
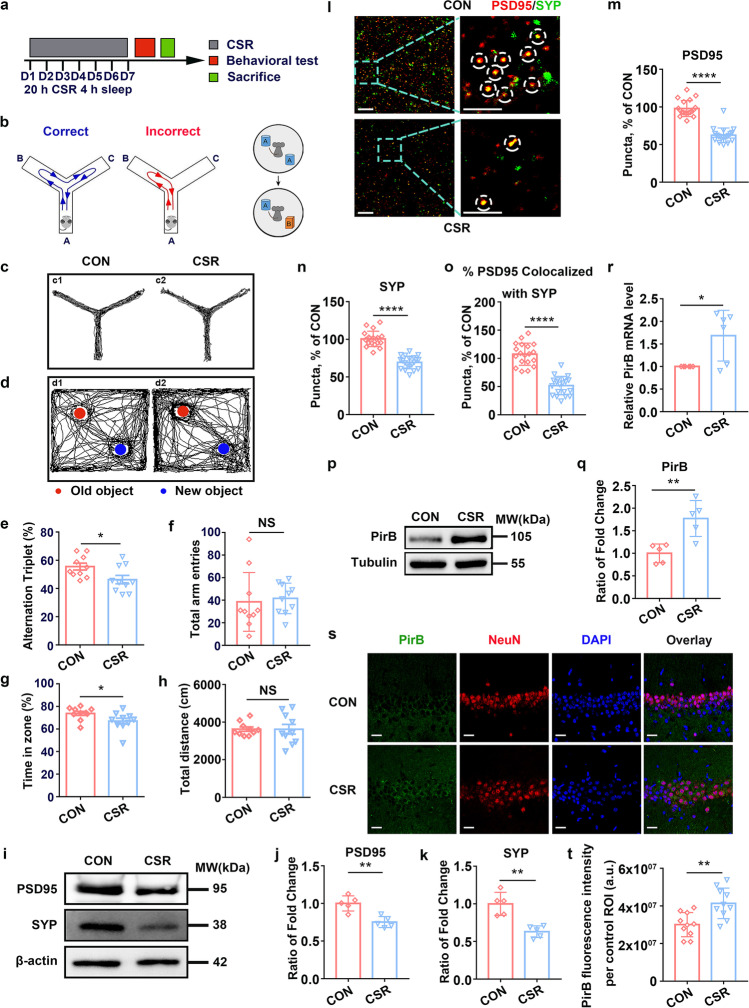
Cognitive function and the expression of synaptic proteins and PirB in the hippocampus of CSR mice. a The experimental protocol for CSR is presented. b left, c Representative Y maze test trajectories of control and CSR mice. b right, d Representative NOR test trajectories of control and CSR mice. e, f The percent of spontaneous alteration rates and total number of arm entries in the Y maze test were measured (n = 10). g, h The recognition index and total travel distance in the NOR test were measured (n = 10). i Western blot analysis of hippocampal PSD95 and SYP levels in control and CSR mice. j, k Ratio of fold change from Western blot. The PSD95 (n = 5) and SYP (n = 5) levels were significantly lower in CSR mice than in control mice. l–o Superresolution SIM images and quantification of PSD95 (red, n = 19–20) and SYP (green, n = 19–20) immunoreactive puncta and their apposition (n = 19–20) using Imaris in the hippocampal CA1 region of the two groups of mice. Scale bars: 5 μm. p Western blot analysis of hippocampal PirB levels in control and CSR mice. q Ratio of fold change from Western blot. The PirB level was significantly higher in CSR mice than in control mice (n = 5). r PirB was upregulated in the hippocampus at the mRNA level after CSR (n = 6). s, t Representative immunofluorescence images and quantification of PirB (green, n = 10) fluorescence intensity of the two groups of mice. Scale bars: 20 μm. Asterisks indicate significant differences between groups (2-tailed, unpaired t test, *p < 0.05, **p < 0.01, ****p < 0.0001). Data are presented as the means ± SD

