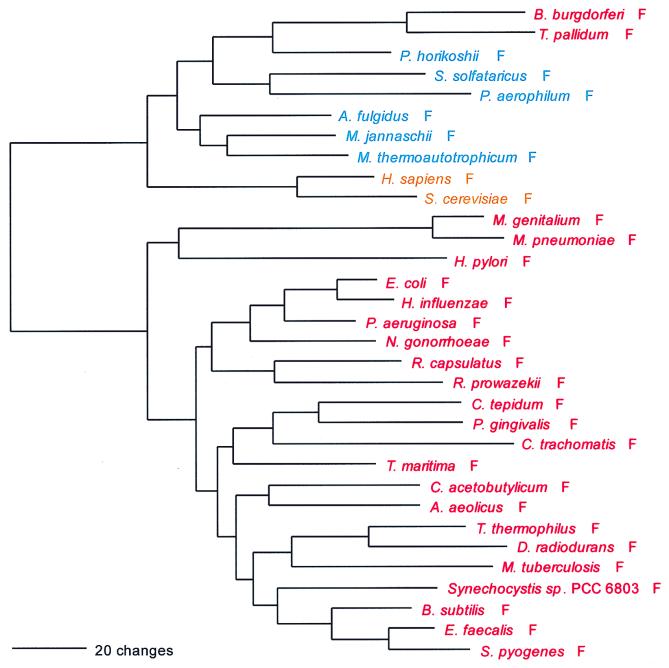
FIG. 2.
Phylogenetic tree of PheRS sequences. Aligned protein sequences were evaluated for the 1,000 most parsimonious trees (61), using amino acid replacement costs based on the BLOSUM 45 matrix (31, 41). Of these trees, we retained the topology with the maximum likelihood of giving rise to the data under the JTT model in protml version 2.2 of the MOLPHY package (1). Additional optimization was performed by removing sequences, one or more at a time, from the tree and using maximum likelihood to select the best from among the 100 to 500 most parsimonious alternative placements and to assign lengths to the branches. The tree has been rooted between the Bacteria and the Archaea plus Eukarya. The sequence identifiers correspond to an organism defined in Table 2, followed by the one-letter amino acid code (in this case F). Sometimes suffixes 1 and 2 are used; they refer to the fact that the given organism contains more than one specific AARS. Bacteria are shown in red, Archaea in blue, and eukaryotes in yellow.

