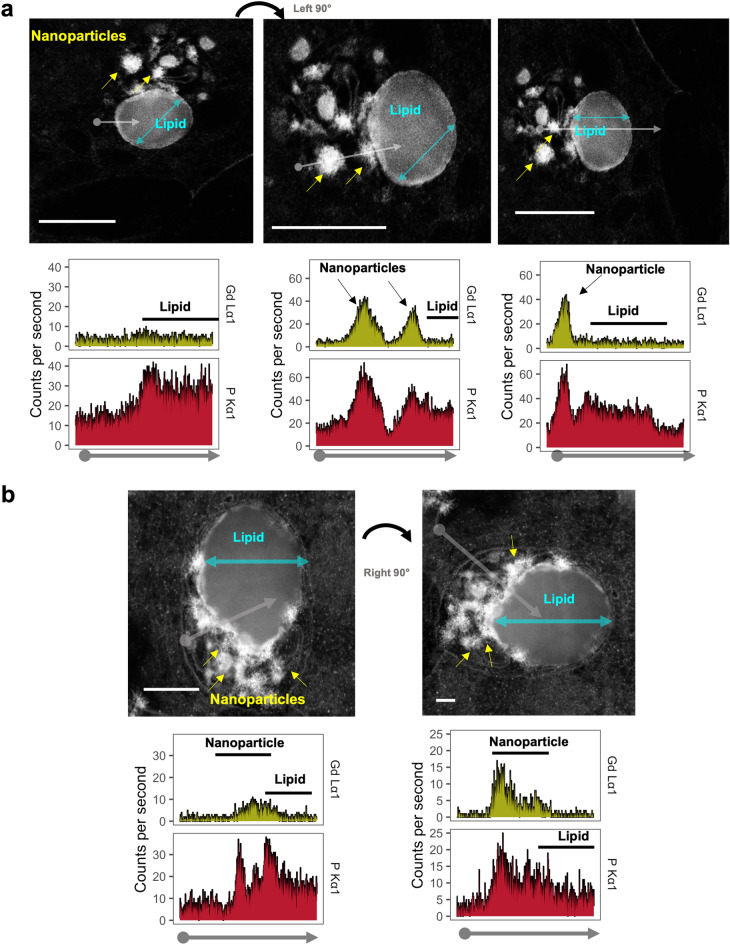
Figure 3.
Energy-dispersive X-ray spectroscopy (XEDS) line scan profiles through sub-cellular regions. Kidney samples were obtained from a MRI contrast agent-treated male mouse. (a) (Left) EDS line scan through intracellular lipid droplet avoiding electron-dense precipitates (arrows). XEDS line scan data (X-ray intensity in counts per second vs distance) for phosphorus (P) corresponding to the non-lipid and unilamellar vesicular regions. (Middle panel) Area on the left rotated to illustrate an XEDS line scan profile (arrow), through precipitates (arrowheads), and a unilamellar vesicle. The nanoparticles exhibited high amounts gadolinium (Gd) and phosphorus (P). (Right) XEDS line scan data through a single electron-dense nanoparticle and unilamellar vesicle. Electron-dense precipitates had high amounts of gadolinium and phosphorus. Bars = 2.5 µm. (b) (Left) XEDS line scan data through electron-dense nanoparticles (arrows), and unilamellar vesicle from a MRI contrast-agent-treated male, and corresponding amounts of gadolinium and phosphorus. (Right) XEDS line scan (grey arrow) through the cytoplasm, vacuole membrane, electron-dense precipitate, and unilamellar vesicle. Bars = 0.1 µm. Corresponding line scan data for elements of interest from the cytoplasm, nanoparticles, and unilamellar vesicle. JEOL 2010F FEGSTEM 200 kV transmission electron microscope, with Oxford Analytical AZTec XEDS system, equipped with XMax 80 N 80 mm2 silicon drift detector.

