Figure 5.
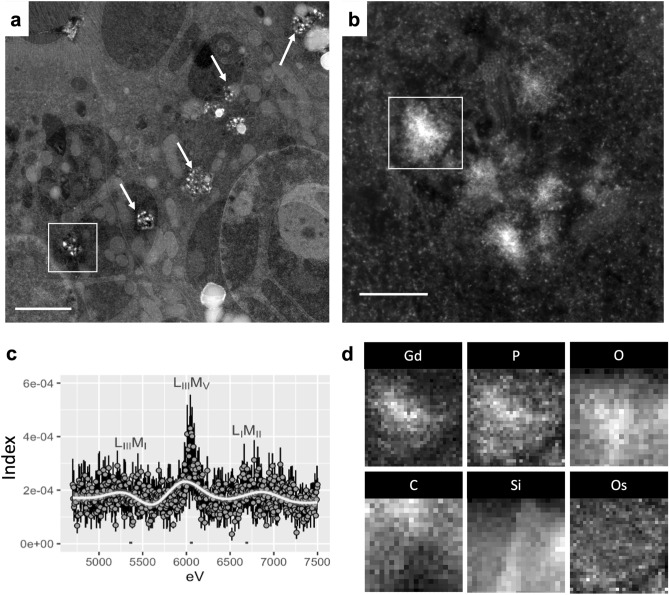
MRI contrast agent-induced nanoparticles are gadolinium rich. Renal cortex was analyzed from a MRI contrast agent-treated mouse. (a) Intracellular electron-dense spiculated nanoparticles pepper renal tubular cells (arrows). Bar = 2 μm. (b Magnified region from (a) showing an intracellular cluster of electron-dense, sea urchin-shaped precipitate. Bar = 200 nm. (c) XEDS data of the precipitate, gadolinium L energy range (LIIIMI, 5.362 eV; LIIIMV, 6.058 eV; and LIMII, 6.690). The L electron shell energies are far from those of physiologic elements, lending these signals to be specific for gadolinium18. Mean ± SE, n = 4 individual precipitates. (d) 2-dimensional (2D) XEDS map for gadolinium (Gd), phosphorus (P), oxygen (O), carbon (C), silicon (Si), and osmium (Os) of the electron-dense nanostructure featured in panel (b). Tecnai F30 300kv transmission electron microscope equipped with an EDAX detector.

