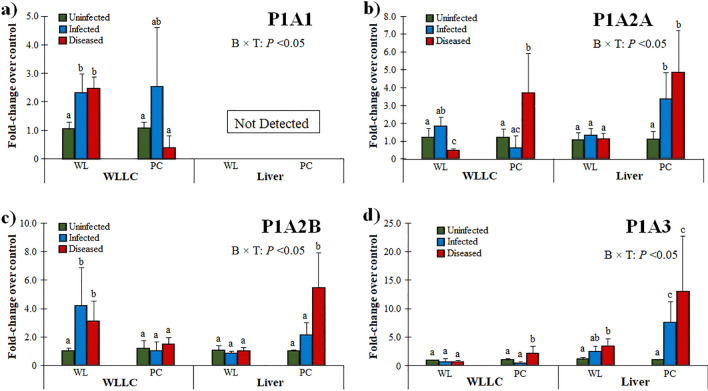
Figure 3.
Relative mRNA expression of P1 PRs in the MD-resistant (WL) and -susceptible (PC) chicken lines. PR expression was measured in WLLC and liver samples using RT-qPCR and fold-changes compared to uninfected controls is shown for P1A1 (a), P1A2A (b), P1A2B (c), and P1A3 (d). Data presented as mean ± standard deviation. Statistical significance was calculated with 2-way ANOVA [Chicken line (B) × Infection (T)]. Superscripts a-c indicates significant differences (P < 0.05) between different groups in specific tissues (WLLCS or Liver) of the two chicken lines.

