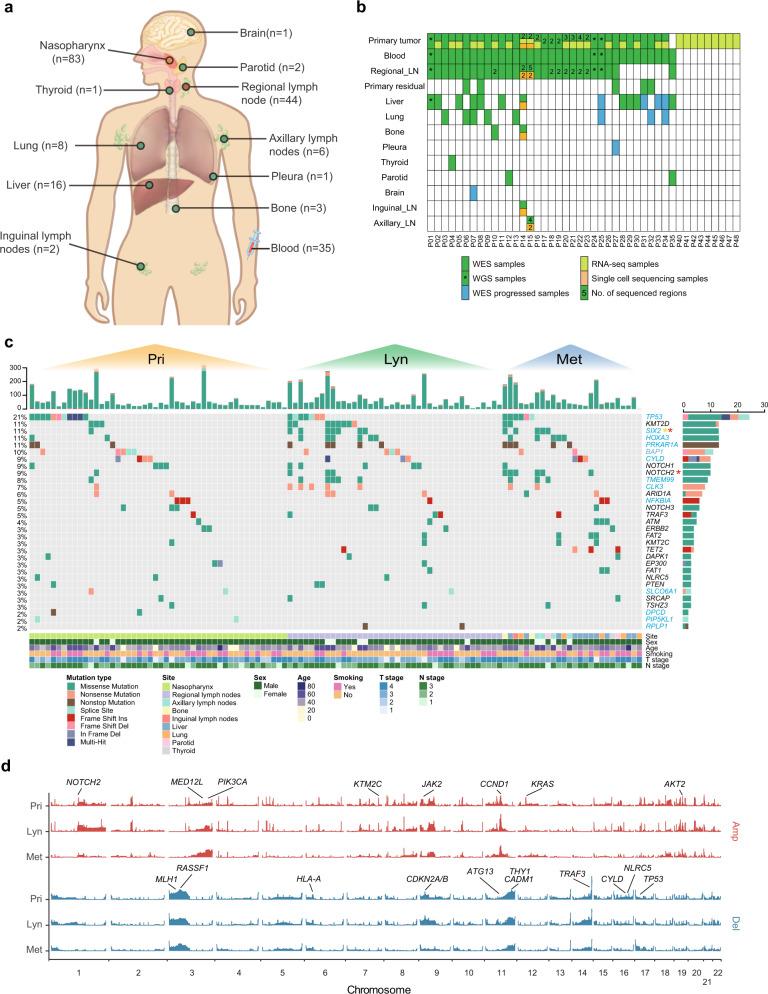
Fig. 1. Genomic landscape of NPC primary and metastatic tumours.
a Site distribution of the sequenced samples. The number of samples from each site is shown in brackets. b The sequencing strategy across all samples. c An overview of somatic mutations detected in primary tumour, regional lymph node metastasis and distant metastasis samples. The top panel shows the total mutations for each sample. The middle panel shows the mutation details for putative driver genes. The significantly mutated genes evaluated by MutSigCV are shown in blue, and the genes with significantly different frequencies in primary tumours and regional lymph node or distant metastasis are marked with asterisks (Pri vs. Lyn in yellow and Pri vs. Met in red). Clinical information is shown in the bottom panel. d The CNV landscape of primary tumour, regional lymph node metastasis and distant metastasis samples. The height of each bar refers to the G-score. Important frequently altered genes are highlighted. Source data are provided as a Source Data file.

