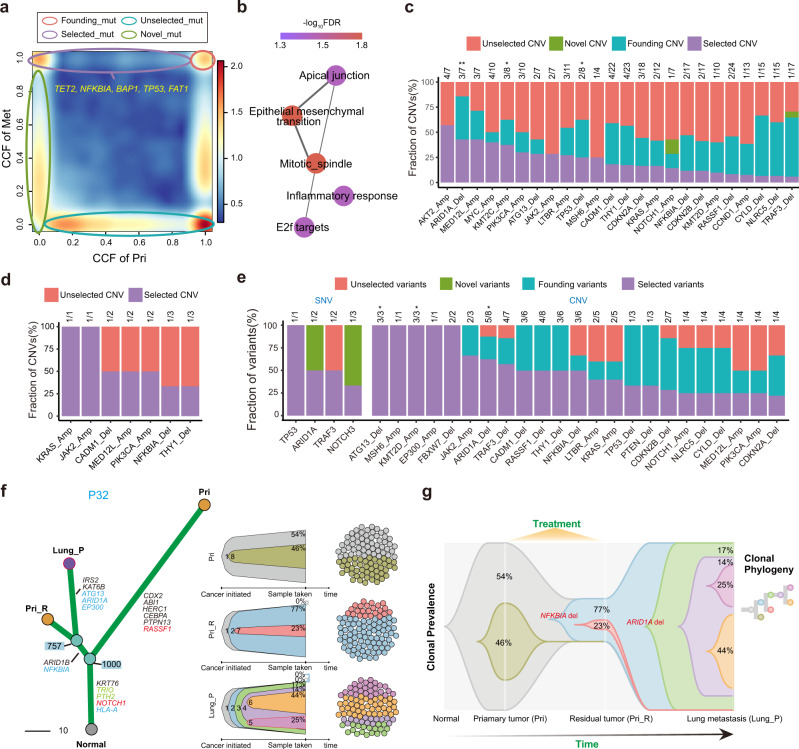
Fig. 2. Driver events during NPC metastasis.
a Scatter plot indicating different variant groups during metastasis. Each variant is measured by CCFs in the primary tumour and distant metastasis from the same patient. The colour range reflects the mutation density. Red circles, founding variants that are clonal both before and after metastasis; purple circles, selected variants that are undetectable or subclonal before metastasis but clonal after metastasis; blue circles, unselected variants that are clonal or subclonal before metastasis and undetectable after metastasis; and green circles, novel variants that are subclonal after metastasis but undetectable before metastasis. Predicted driver genes harbouring SSNVs are marked. b Reactome pathway enrichment of mutated genes in the “selected” group. c Distribution of variant groups during metastasis according to key NPC CNVs. Only selected CNVs are shown, and the number of selected CNVs was annotated. d Distribution of variant groups during progression according to the key CNVs between paired primary tumours and residual tumour after treatment. The number of selected variants is annotated. e Distribution of variant groups during progression according to key variants, including SSNVs and CNVs, between paired primary tumour samples and posttreatment progressed metastatic samples. f The evolutionary landscape of P32. The left panel shows the phylogenetic tree with the key variants highlighted. The right panel shows the subclone-based evolution architecture of each sample and their sampling transect, which reflects the proportion of each subclone at the time of sampling. g Dynamic subclone-based evolution architecture of P32 plotted using TimeScape, with the proportion of each cluster at the time of sampling annotated. Source data are provided as a Source Data file.

