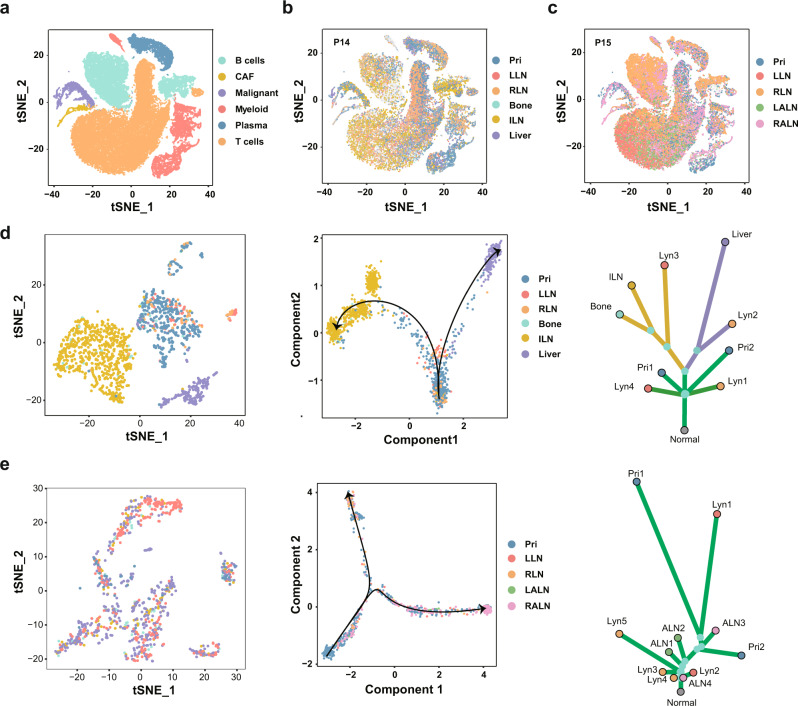
Fig. 4. Lymphatic and hematogenous evolution models revealed by scRNA-seq.
a The t-SNE plot showing the unsupervised clustering results with cell types annotated. b The t-SNE plot showing the sample locations of single cells from P14. c The t-SNE plot showing the sample locations of single cells from P15. d, e Pseudotime trajectory analysis of tumour cells from P14 (d) and P15 (e). The left panel shows the t-SNE plot of tumour cells coloured according to the sample locations, the middle panel shows the evolutionary trajectory of tumour cells, and the right panel shows the corresponding phylogenetic tree. Source data are provided as a Source Data file. Pri, LLN, RLN, ILN, LALN, and RALN: primary tumour, left regional lymph nodes, right regional lymph nodes, inguinal lymph nodes, left axillary lymph nodes and right axillary lymph nodes, respectively.

