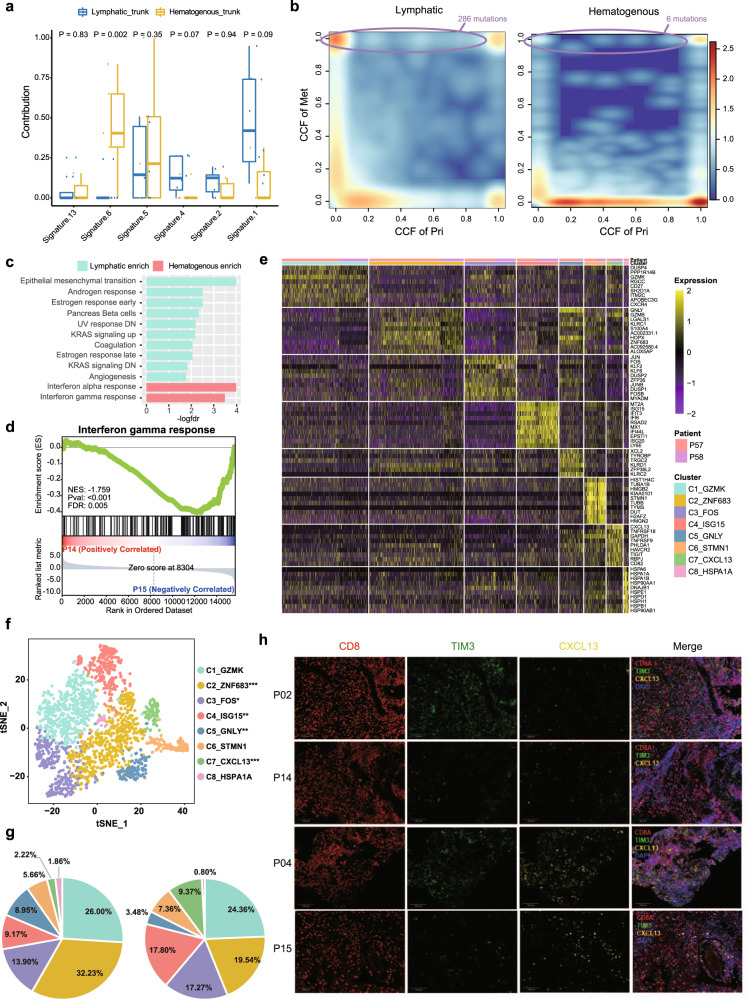
Fig. 5. Molecular characteristics of the lymphatic and hematogenous evolutionary modes.
a Mutation signature profile of trunk mutations in samples with the lymphatic pattern (n = 8) and the hematogenous pattern (n = 5). The y-axis shows the contribution of each signature. In each box plot, the centre line represents the median, the bounds represent the first and third quartiles, and whiskers extend from the hinge to the largest value no further than 1.5 × interquartile range (IQR) from the hinge. After adjusting for age, gender and tumour stage by using covariance analysis model, the Wilcoxon signed-rank test (two-sided) was used to calculate the P values. b Scatter plots showing the selection pattern of all mutations during metastasis in the lymphatic (left) and hematogenous (right) routes according to the comparison of the CCF for each variant between primary (x-axis) and metastatic (y-axis) tumours. The colour range reflects the mutation density in the scatter plot. The circle box indicates the selected mutations with the numbers of selected mutations marked. c Hallmark GSEA of lymphatic vs. hematogenous primary tumour using bulk RNA-seq data. d Hallmark GSEA of P14 primary tumour cells vs. P15 primary tumour cells using scRNA-seq data. An empirical phenotype-based permutation test (two-sided) was used to calculate the P value and false discovery rate (FDR). e Heatmap showing the differentially expressed genes among different CD8+ T-cell subclusters from primary tumours. Information on the clusters and patient-of-origin is shown at the top. f The t-SNE projection of CD8+ T cells from primary tumour, with cells coloured based on the unsupervised clustering results. The statistical significance of the difference in the proportion of each cell type between P14 and P15 was measured using Fisher’s exact test (two-sided) and is marked in the figure legend (“*”, P < 0.05; “**”, P < 0.01; “***”, P < 0.001). g Pie charts showing fractions of CD8+ T-cell subclusters for P14 (left) and P15 (right). h Infiltration of exhausted CD8+ T cells enriched in the microenvironment of the hematogenous route. Independent experiments were conducted in patients with clear metastatic route classification (n = 13). Representative multiplex immunohistochemistry (IHC) staining images of CXCL13+ TIM3+ CD8+ T cells in the lymphatic route (P02 & P14) and hematogenous route (P04 & P15). Scale bar, 100 μm. Source data are provided as a Source Data file.

