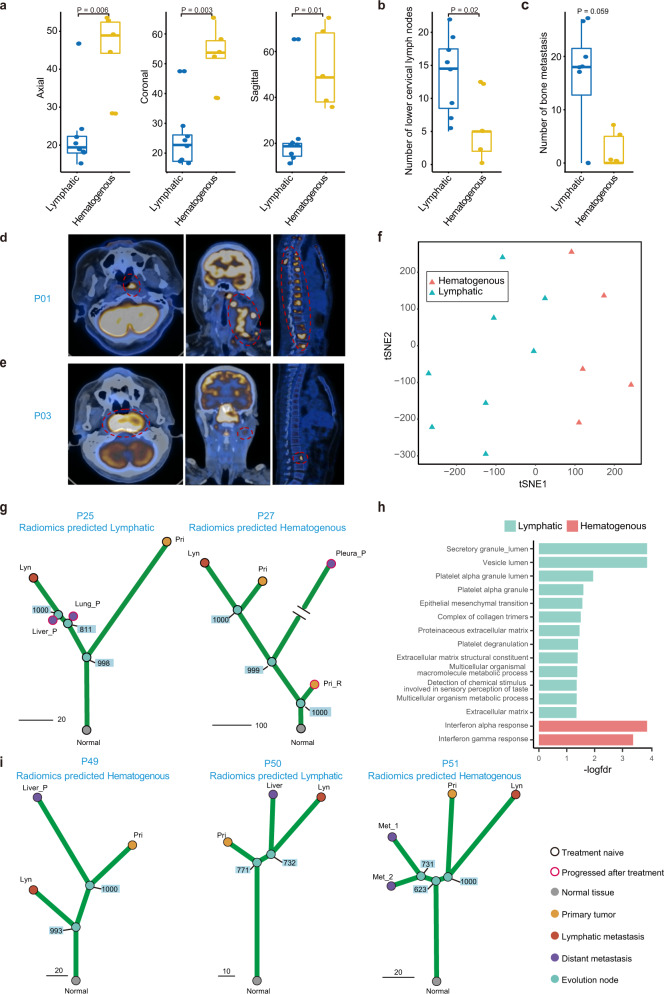
Fig. 6. Imaging characteristics distinguished the lymphatic metastatic pattern from the hematogenous metastatic pattern.
a Box plot shows the longest diameter of the primary tumour in the axial (left), coronal (middle) and sagittal views (right) in the lymphatic (n = 8) and the hematogenous (n = 5) models. In each box plot, the centre line represents the median, the bounds represent the first and third quartiles and whiskers extend from the hinge to the largest value no further than 1.5 × interquartile range (IQR) from the hinge. The Wilcoxon signed-rank test (two-sided) was used to calculate the P values; “*”P < 0.05. b, c Box plot shows the number of lower cervical lymph nodes (b) and bone metastasis lesions (c) in the lymphatic (n = 8) and hematogenous (n = 5) models. In each box plot, the centre line represents the median, the bounds represent the first and third quartiles and whiskers extend from the hinge to the largest value no further than 1.5 * interquartile range (IQR) from the hinge. The Wilcoxon signed-rank test (two-sided) was used to calculate the P values. “*”p < 0.05. d, e Positron emission tomography-computed tomography (PET-CT) images of the primary tumour (left), regional lymph node metastasis (middle) and bone metastasis (right) in the lymphatic (d) and hematogenous (e) models. The red dashed circle indicates tumour location. f The t-SNE plot shows the unsupervised clustering results of radiomics features of patients in the lymphatic and hematogenous models. g Phylogenetic tree with the bootstrap value on each divergence node showed the evolutionary route of patients without complete matched primary, regional lymph node metastasis and distant metastasis samples before treatment. The radiomics prediction model classifies patients with metastatic tumour after treatment into the lymphatic (left) and hematogenous (right) groups. h GSEA of radiomics model-predicted lymphatic vs. hematogenous primary tumour using bulk RNA-seq data. i Radiomics prediction model results and phylogenetic trees for newly collected patients to further validate the radiomics prediction model. *P: progressed samples after treatment. Source data are provided as a Source Data file.

