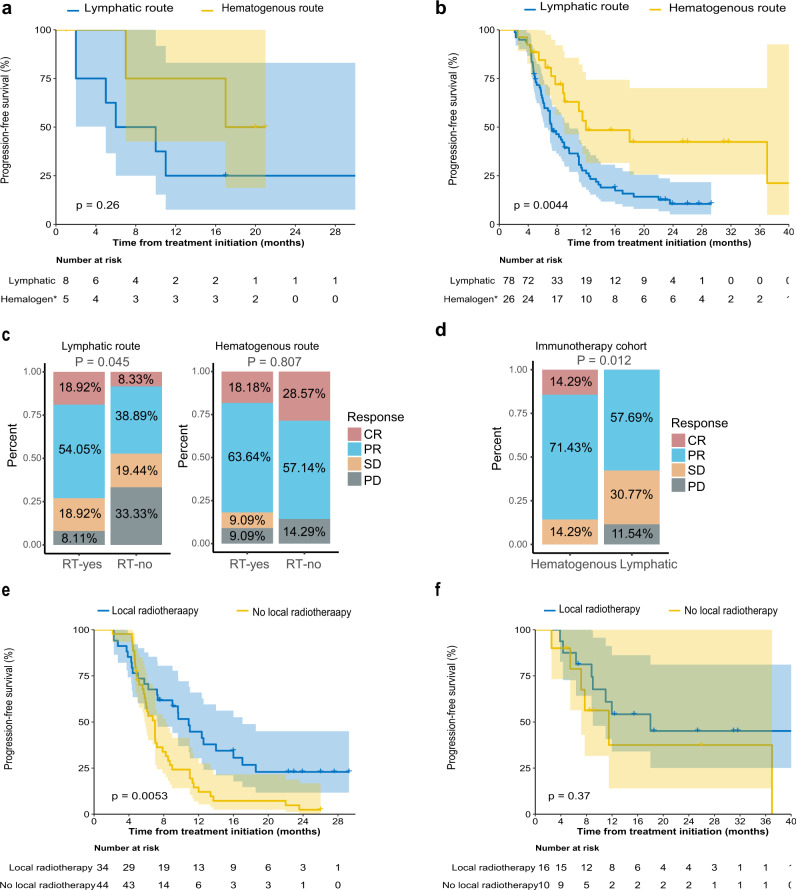
Fig. 7. Different clinical outcomes between the “lymphatic” and “hematogenous” metastatic routes.
a Kaplan‒Meier curves of progression free survival (PFS) in the 13 NPC with identified metastatic models via genomic phylogenetic tree. The data are shown along with 95% confidence intervals. The log-rank test was used to calculate the P value (two-sided). b Kaplan‒Meier curves of PFS comparing the radiomics-predicted lymphatic and hematogenous metastatic models in the de novo metastatic NPC cohort. The data are shown along with 95% confidence intervals. The log-rank test was used to calculate the P value (two-sided). c Bar plot showing the different treatment response rates between patients who received locoregional radiation therapy and those who did not in the primary diagnosed metastatic NPC cohort in the lymphatic (left) and hematogenous (right) models. RT: radiation therapy. d Bar plot showing the different response rates to combination immunotherapy between the lymphatic and hematogenous groups in the immunotherapy NPC cohort. e, f Kaplan‒Meier curves of PFS between metastatic patients who received local radiotherapy and those who did not receive local radiotherapy in patients with metastases emerging via the lymphatic route (e) or the hematogenous route (f). The data are shown along with 95% confidence intervals. The log-rank test was used to calculate the P value (two-sided).

