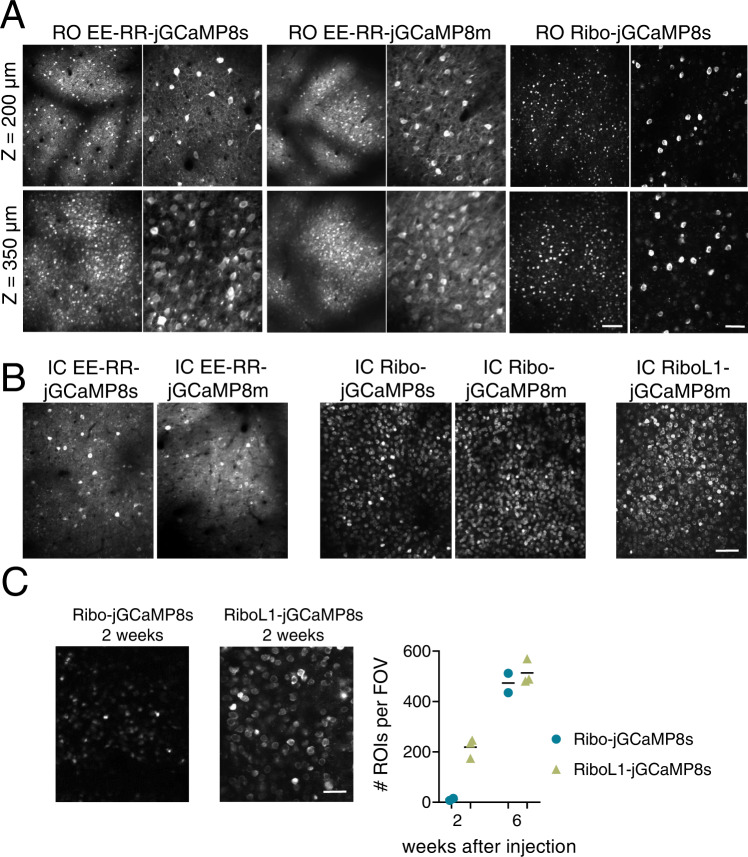
Fig. 3. Soma-targeted jGCaMP8 expressed by RO and IC injections in primary visual cortex.
A Representative example images from RO injected mice expressing EE-RR-jGCaMP8s and m, and Ribo-jCaMP8s, at two different depths in cortex. Scale bars on lower right aligned images indicate 150 and 50 µm, respectively. All images shown are average intensity projections from 2000 frames with identical adjustments to brightness and contrast. Data from EE-RR constructs was acquired 4 weeks after virus injections, and 6 weeks for the ribosome-tethered construct. B Similar to A, showing expression after IC injections. Note the high number of identifiable single neurons with ribosome-tethering, compared to jGCaMP and EE-RR-jGCaMP8. Scale bar indicates 100 µm. C Development of expression of Ribo-jGCaMP8s and RiboL1-jGCaMP8s after IC injections. Two weeks after virus injections, Ribo-jGCaMP8s was only visible as static spots, while with RIboL1-jGCaMP8s individual neurons were identified. Six weeks after injection the two constructs were expressed similarly, as shown in B. Right panel shows the number of identified neurons per field of view 2 and 6 weeks after virus injections, identified from average intensity projections of 250 imaging frames. Field of view size was 420 × 350 µm, and n = 2 and 3 mice for Ribo-jGCaMP and RiboL1-jGCaMP, respectively. Scale bar indicates 30 µm. A–C The results were reproduced in n ≥ 3 mice.

