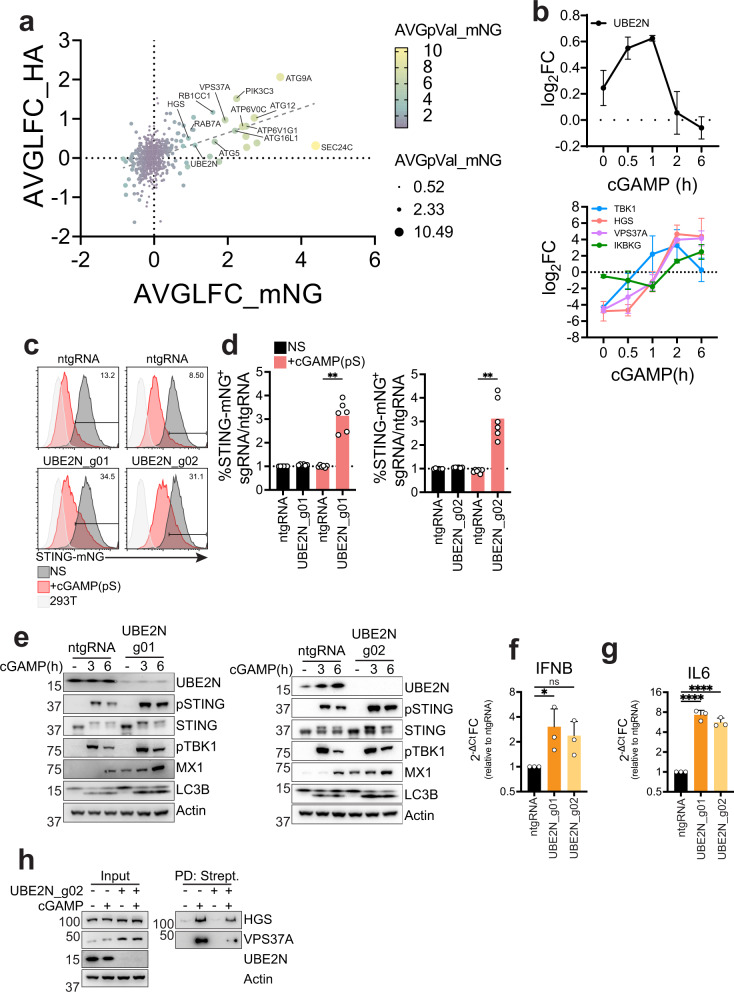
Fig. 6. A targeted CRISPR screen identifies UBE2N as a regulator of STING degradation.
a Correlation plot of Average log2 Fold-Change (AVGLFC) for the CRISPR screen in STING-mNG or STING-HA cell lines. Color and size represent Average -log10(p-value) (AVGpVal) for the screen in mNG cells. b log2 fold-change (FC) enrichment of the indicated proteins in TurboID proteomics described in Fig. 1. c Percentage of STING-mNG positive cells in cells stimulated with 4 µg/ml 2′3′-cGAMP(pS)2 (in medium) for 6 h. One representative plot of n = 3 experiments with n = 2 technical replicates per experiment. d Ratio %STING-mNG positive of each sgRNA over %STING-mNG positive cells of the control non-targeting sgRNA (ntgRNA) in cells stimulated as in c. n = 3 independent experiments with n = 2 technical replicates per experiment. Each dot represents an individual replicate. One-way ANOVA with Dunnet multiple comparisons test. e Immunoblot of the indicated proteins in BJ1 stimulated with 0.5 µg/ml cGAMP (in perm buffer) for the indicated times. One representative experiment of n = 3 independent experiments. f qPCR for IFNβ in BJ1 stimulated with 0.5 µg/ml cGAMP (in perm buffer) for 8 h. Shown is 2−ΔCt fold change (FC) calculated as ratio 2−ΔCt sgRNA/2−ΔCt ntgRNA for cells stimulated with cGAMP. n = 3 independent experiments. One-way ANOVA on log-transformed data with Dunnet multiple comparison test. g Same as in f for IL6. h Immunoblot of the indicated proteins in 293 T STING-TurboID stimulated with 2 µg/ml cGAMP (in perm buffer) for 3 h. One representative experiment of n = 3 independent experiments. In all panels, bar plots or lines show mean and error bars standard deviation. Marker unit for Westen blots is KDa. *p < 0.05, **p < 0.01, ***p < 0.001, ****p < 0.0001, ns not significant.

