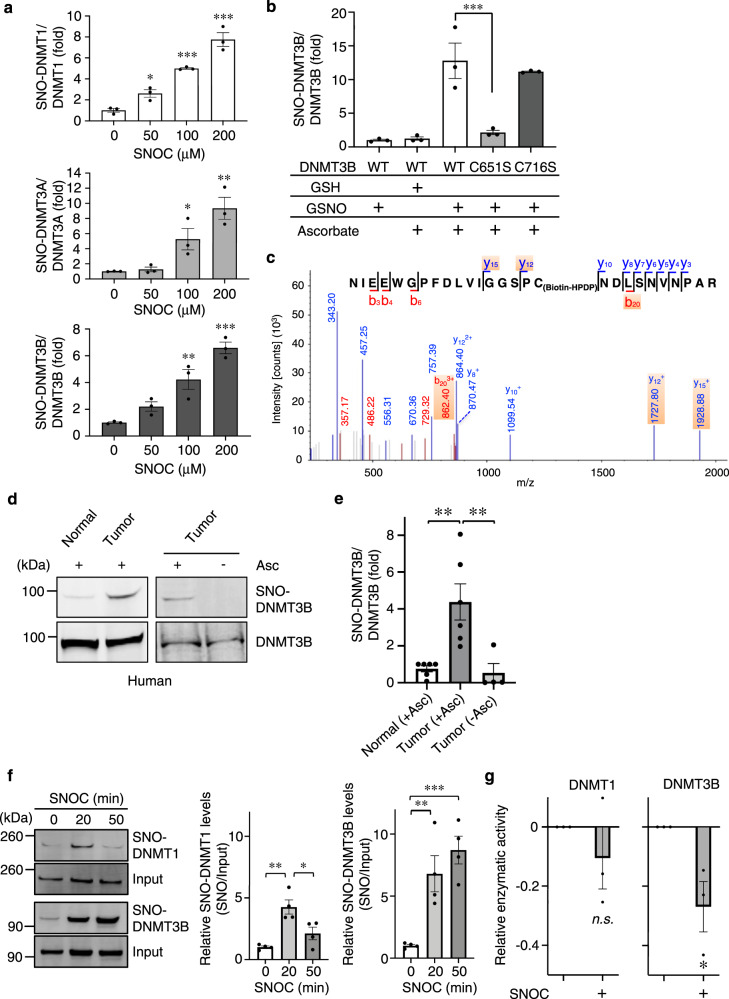
Fig. 1. NO regulates DNMT3B activity via S-nitrosylation.
a SNO-DNMT formation after exposure to an NO donor. HEK293 cells were exposed to the indicated concentration of SNOC. After 1 h, SNO-DNMTs were detected by biotin-switch assay. Values are expressed as mean ± s.e.m. (n = 3; *P < 0.05, **P < 0.01, ***P < 0.001 vs. SNOC 0 µM by one-way ANOVA with Dunnett’s post hoc test). b HEK293 cells, transduced with WT or C-to-S FLAG-tagged DNMT3B mutants, were exposed to 100 μM GSNO or GSH. After 1 h, SNO-DNMT3B was detected using biotin-switch assay with anti-FLAG antibody. Densitometric quantification of SNO-DNMT3B/total DNMT3B formation from biotin-switch and immunoblot data, as illustrated in Supplementary Fig. 1e. Values are mean ± s.e.m. (n = 3; ***P < 0.001 by one-way ANOVA with Bonferroni’s post hoc test). c Mass spectrometry identification of S-nitrosylated Cys-containing peptide in full-length DNMT3B. Representative annotated LC-MS/MS spectrum of biotin-labeled Cys651-containing peptide after trypsin digestion. d, e Representative human colon cancer or control tissue subjected to biotin-switch assay to detect SNO-DNMT3B that occurred in vivo (d). Ratio of human SNO-DNMT3B/total DNMT3B from biotin-switch assay and immunoblot analysis, respectively, quantified by densitometry (e). Values are mean ± s.e.m. (n = 4–6; **P < 0.01 by one-way ANOVA with Tukey’s post hoc test). f Differential temporal levels of S-nitrosylation of DNMT1 and DNMT3B in cell-based assays. For cell-based assays, HEK293T cells expressing myc-tagged DNMT1 or DNMT3B were exposed to 200 μM SNOC. After 20 and 50 min, nuclear extracts were isolated, and SNO-DNMTs were detected by biotin-switch assay. Ratio of SNO-DNMT/total DNMT quantified by densitometry. Values are expressed as mean ± s.e.m. (n = 4; *P < 0.05, **P < 0.01 by one-way ANOVA with Tukey’s post hoc test). g Effect of SNOC on DNMT activity in HEK293T cells. HEK293T cells expressing DNMT1 or DNMT3B were exposed to SNOC. Thirty minutes later, nuclear extracts were isolated, and DNMT enzymatic activity was determined after approximately 1 h. Values are mean ± s.e.m. relative to basal activity (n = 3; *P < 0.05, by two-tailed Student’s t-test). Source data are provided as a Source data file.

