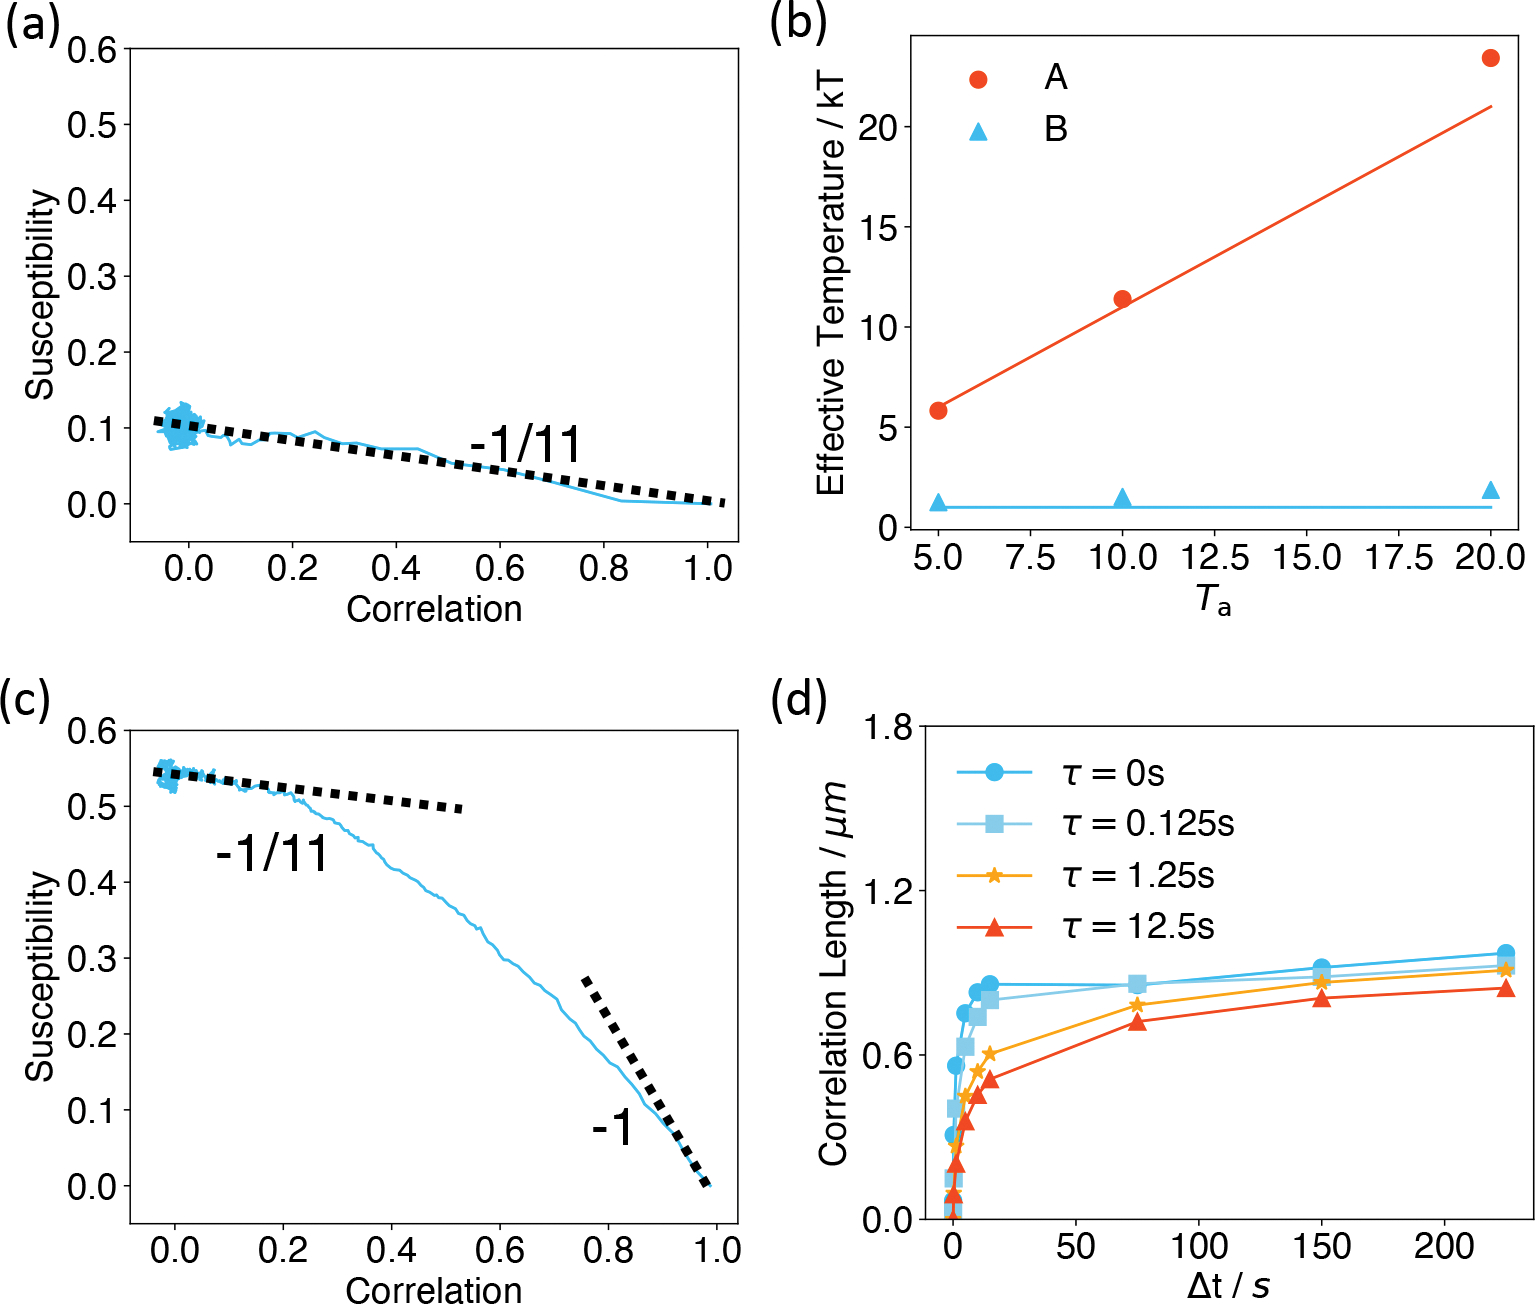
Figure 5:

The effective temperature of active systems computed using the fluctuation-dissipation ratio. (a,c) Susceptibility as a function of correlation for the system with Ta = 10T, τ = 0 s (a) and τ = 1.25 s (c). The dashed lines correspond to the thermal temperature −1/T and the theoretical value −1/(Ta + T) for non-correlated active forces. (b) Effective temperatures of A/B compartments computed using the fluctuation-dissipation ratio for Ta = 5, 10, and 20T at τ = 0 s are shown as dots. The red line corresponds to Ta + T, while the blue line represents the constant T. (d) Correlation lengths as functions of time interval Δt for different correlation time τ of the colored noise.
