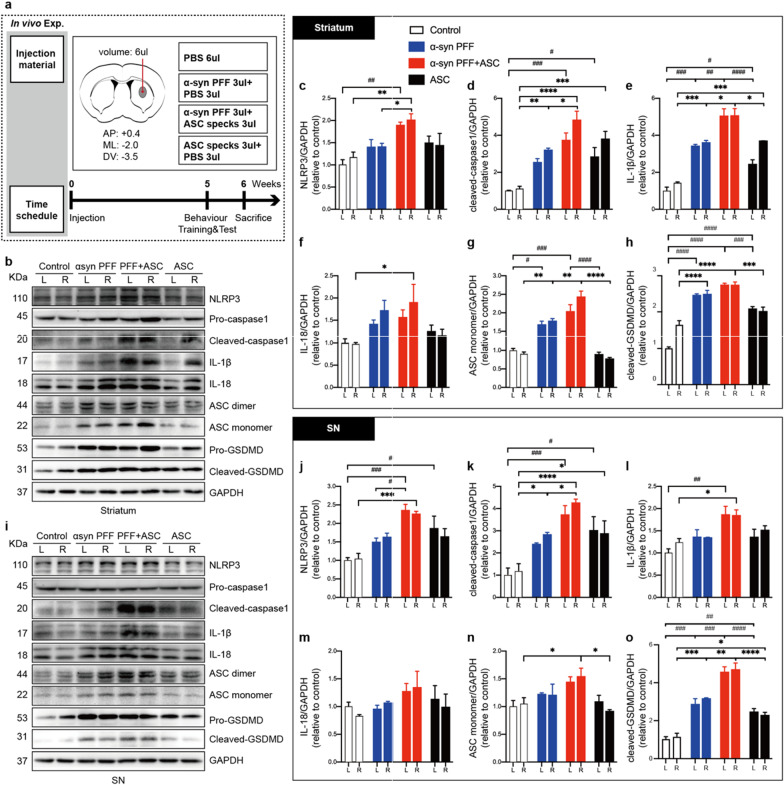
Fig. 3.
ASC specks augmented NLRP3 inflammasome activation in human A53T mutant α-synuclein PFFs-induced PD mice. a Diagram showing the experimental design and time course of treatment schedules in vivo. The number of mice in each group: PBS group, n = 11; PFFs treated group, n = 10; PFF + ASC co-injected group, n = 13; ASC specks treated group, n = 10. b–h IB analysis and quantification of NLRP3 inflammasome signals in bilateral striatum of indicated mice (n = 3 or 4). i–o IB analysis and quantification of NLRP3 inflammasome signals in bilateral SN of indicated mice (n = 3 or 4). Quantifications of NLRP3, cleaved-caspase 1, IL-1β, IL18, ASC monomer and cleaved GSDMD levels were performed by densitometric analysis normalized to GAPDH, relative to the contralateral striatum or SN regions of the control group. Values are presented as mean ± SEM and are analyzed by two-way ANOVA followed by Tukey’s post hoc test for multiple comparisons. Significance levels are: *p < 0.05, **p < 0.01, ***p < 0.001, ****p < 0.0001 (Right hemisphere of brain tissues); #p < 0.05; ##p < 0.01; ###p < 0.001; ####p < 0.0001(Left hemisphere of brain tissues). L left, R right, SN substantia nigra

