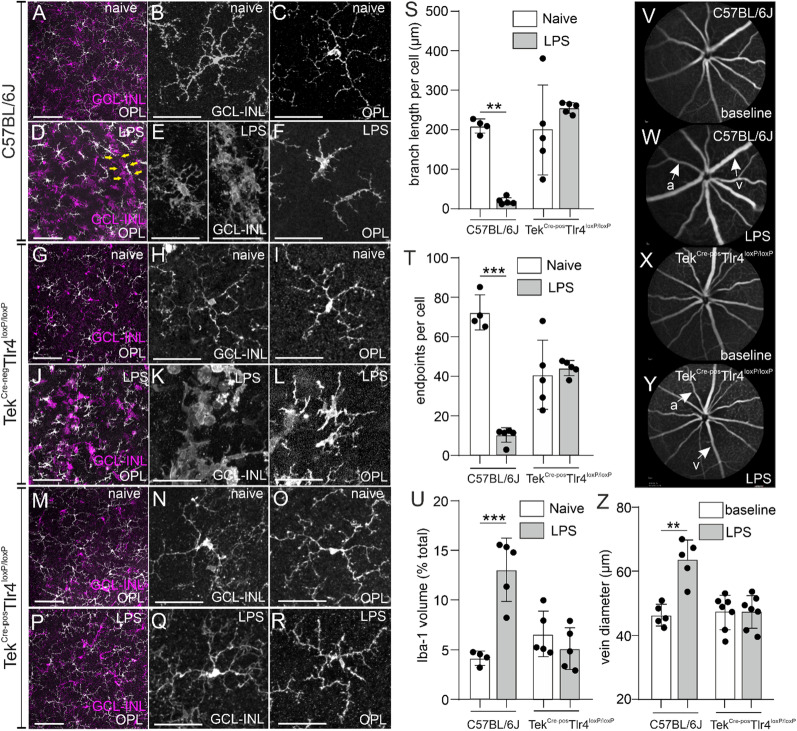
Fig. 2.
Systemic LPS fails to trigger microglia activation and retinal vasodilation in endothelial Tlr4-deficient mice. Representative images of Iba-1-stained retinal whole mounts in naïve (A, G, M) and LPS-challenged (D, J, P) C57BL/6J, TekCre−negTlr4loxP/loxP and TekCre−posTlr4loxP/loxP mice, respectively. Iba-1pos cells located in the GCL-INL and the OPL are shown in magenta and white, respectively. Yellow arrows in D indicate the clustering of Iba-1pos cells around a retinal vessel. In naïve C57BL/6J mice, microglia cells have a ramified morphology throughout the retina (B, C). After the LPS challenge, Iba-1pos cells adopt a bushy or amoebic morphology and accumulate around retinal blood vessels in the GCL-INL (E). In the OPL, these cells have an amoebic or rod-like shape (F). The morphology of Iba-1pos cells before or after the LPS challenge in TekCre−negTlr4loxP/loxP mice was comparable to C57BL/6J mice (H, I, K, L). Individual Iba-1pos cells of TekCre−posTlr4loxP/loxP mice had a ramified morphology both in the naïve and the LPS-challenged group (N, O, Q, R). Quantification of average branch length (S; n = 4–5 mice per group), number of endpoints per cell (T; n = 4–5 mice per group) and Iba-1 occupied volume (U; n = 4–5 mice per group) on images obtained from retinal whole mounts. Reduced branch length, less endpoints per cell and increased Iba-1 occupied volume were detected in the C57BL/6J but not the endothelial Tlr4 knockout mice. Representative images of fluorescein angiographs at baseline (V, X) and after the LPS challenge (W, Y) in C57BL/6J and TekCre−posTlr4loxP/loxP mice, respectively and quantification of vein dilation (Z; n = 5–7 mice per group). Vein diameter was significantly increased in LPS-challenged C57BL/6J mice compared to baseline, but not in TekCre−posTlr4loxP/loxP mice. The quantification data are reported as mean ± SD. The data were analyzed separately for each genotype with 2-tailed unpaired t-test (S–U) or 2-tailed paired t-test (Z). **p < 0.01, ***p < 0.001. a Artery; v vein; GCL-INL ganglion cell layer-inner nuclear layer; OPL outer plexiform layer. Scale bars: left panel: 100 μm; middle and right panels: 50 μm

