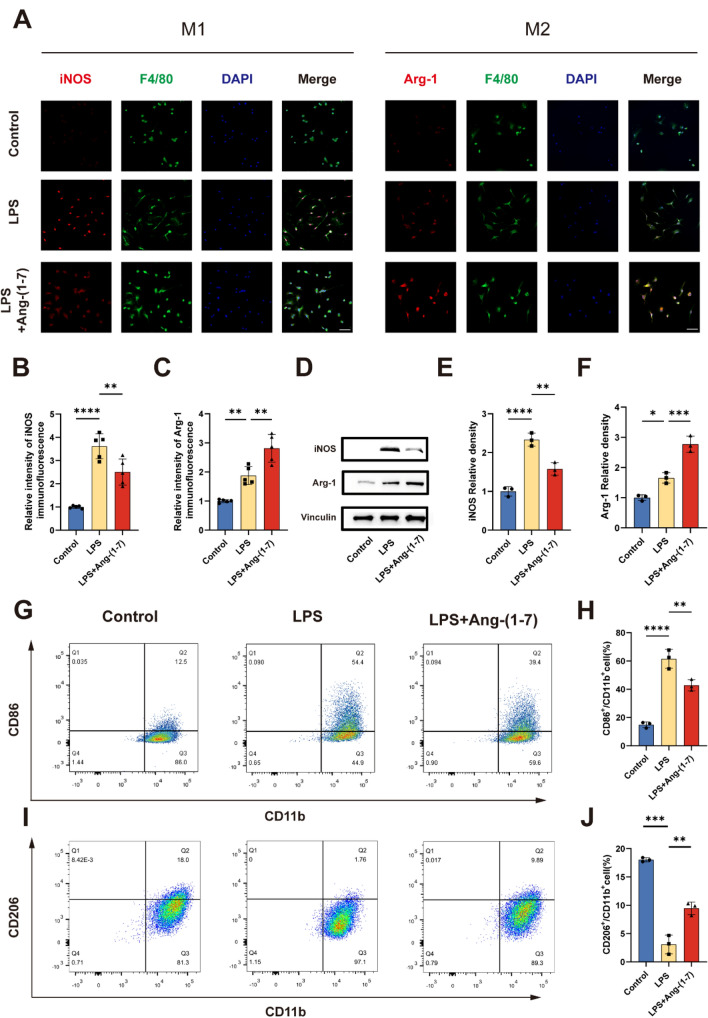
Fig. 2.
Ang-(1–7) regulates the polarization of macrophages towards the M2 phenotype. a–c Double-staining for F4/80 (green)/iNOS (red) or F4/80 (green)/Arg-1 (red) in each group of macrophages (scale bar: 50 μm, n = 5). d–f Representative immunoblots and quantification of macrophages in each group showing the expression of iNOS (d, e) and Arg-1 (d, f) after treatment for 24 h (n = 3). g-h The ratio of M1 macrophage phenotype-related surface markers, CD86/CD11b, were determined by flow cytometry for each group (n = 3). i–j The ratio of M2 macrophage phenotype-related surface markers, CD206/ CD11b, were determined by flow cytometry for each group (n = 3). In a–j, Error bars indicated the mean ± SD for three separate experiments. *P < 0.05, **P < 0.01, ***P < 0.001, and ****P < 0.0001. One-way ANOVA followed by Tukey's Post Hoc test

