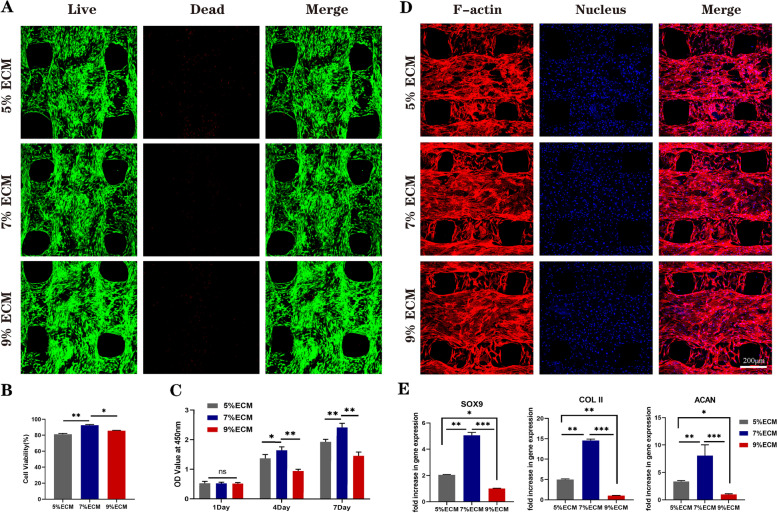
Fig. 3.
Biocompatibility and chondrogenic differentiation analysis of pure ECM scaffolds. A Live/dead staining (green: live cells, red: dead cells) of BMSCs on the pure ECM scaffold; B Percentage of live cells on scaffolds (n = 3); C CCK-8 assay results of BMSCs cultured on ECM scaffolds for 1 day, 4 days, and 7 days (n = 4); D Morphology of BMSCs on the pure ECM scaffold (red: F-actin, blue: nucleus); E Expression of SOX 9, ACAN and Col 2A1 of the SMSCs on 5, 7 and 9% ECM scaffolds (n = 3). Statistical analysis: *p < 0.05, **p < 0.01, ***p < 0.001

