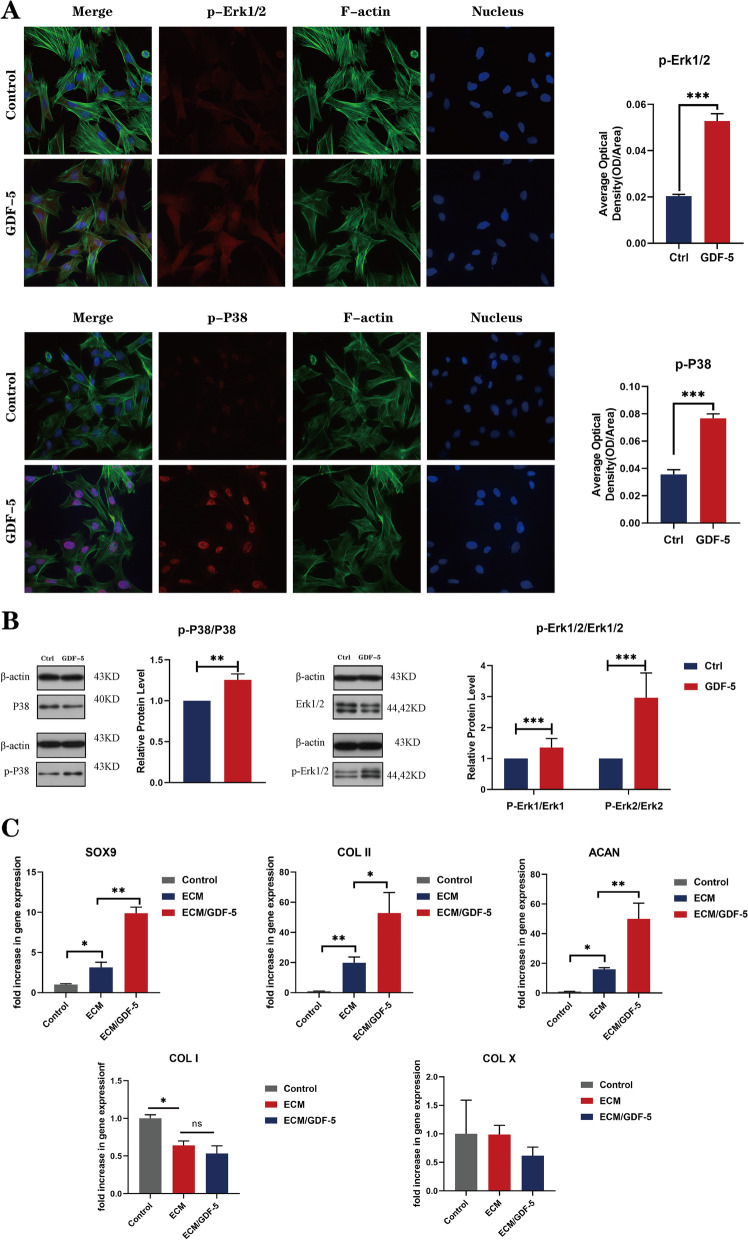
Fig. 6.
GDF-5 promoted BMSC chondrogenic differentiation by upregulating the phosphorylation of Erk1/2 and P38. A Immunofluorescence detection of p-Erk1/2 and p-P38. (F-actin: green, nucleus: blue, and protein: red). Scale bars are 25 μm. Quantitative analysis of the average optical density of fluorescence images. Data are presented as the means ± SDs (n = 3); B WB analysis of the expression levels of Erk 1/2, p-Erk 1/2 and p-P38 and quantitative analysis of the expression levels of Smad 2/3, p-Smad2 and p-Smad3. Data are presented as the means ± SDs (n = 3); C Statistics of the total number of migrating cells in the Transwell assays (n = 3); D Expression of SOX 9, ACAN, COL II, COL I and COL X in SMSCs on hybrid ECM scaffolds (n = 3). Statistical analysis: *p < 0.05, **p < 0.01, ***p < 0.001

