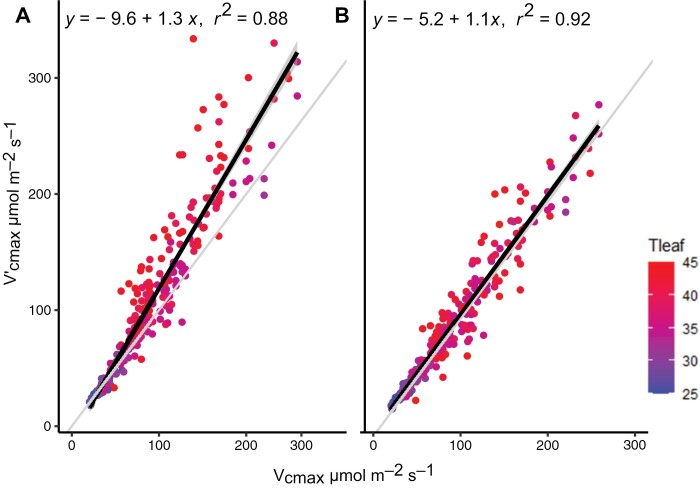
Fig. 1.
Comparison of linear regression models between Vcmax estimated from full A–Ci curves against apparent photosynthetic capacity estimated by the ‘one-point method’ (Vʹcmax; Equation 2) (A), and the modified version including the temperature dependency (Vʹcmax–ρ; Equation 5) (B). The light gray line is the 1:1 relationship.

