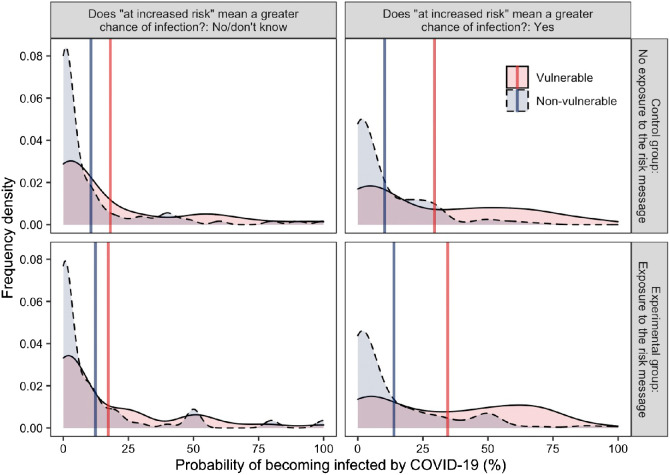
Figure 4. Participants’ Perceived Probability of Infection From COVID-19 in Study 3.
Note. The figure shows perceived COVID-19 infection probabilities for vulnerable and nonvulnerable individuals as a function of participants’ interpretation that risk referred to the probability of infection (no/do not know, left panels, n = 169 vs. yes, right panels, n = 260) and as a function of the experimental message condition (control—no risk message, top panels, n = 216 vs. experimental exposure to the message, lower panels, n = 216). The shaded area shows the frequency density of responses. Solid vertical lines give the mean probability estimate in each condition. COVID-19 = coronavirus disease. See the online article for the color version of this figure.

