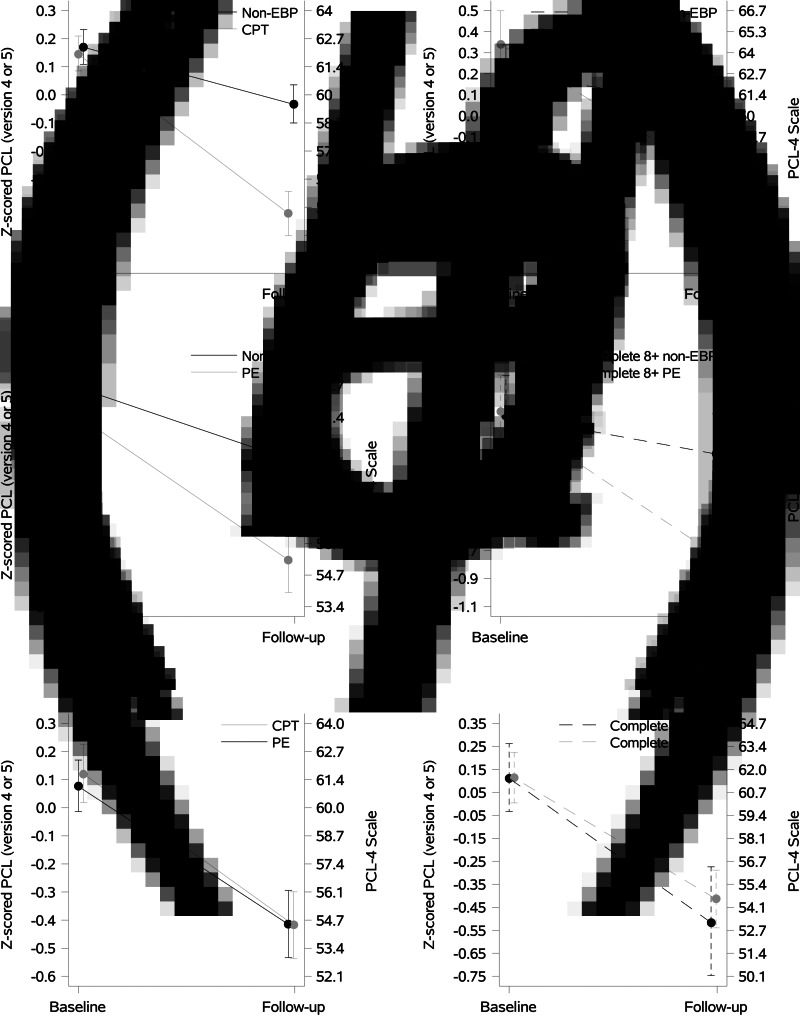
Fig. 2.
Line figures of Z-scored PCL at baseline and follow-up by treatment group. Patients who initiated EBP within 2 weeks of baseline were matched to non-EBP controls (propensity score matching) and the resulting matched sample was weighted by inverse probability of follow-up. Figures A, C and E are analogous to an ITT analysis, where patients in the treatment group may not have perfect adherence to their assigned treatment. Figure B, D and F are analogous to a complete adherence analysis, where patients who deviated from their assigned treatment strategy were artificially censored and the uncensored patients were weighted by inverse probability of censoring.

