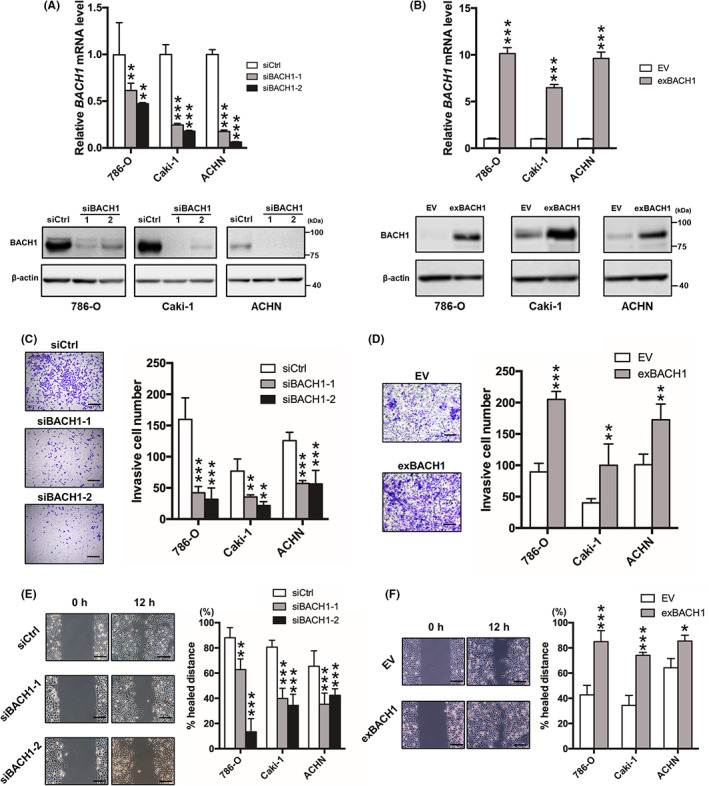
FIGURE 2.

Role of BACH1 in renal cell carcinoma cell invasion and migration in vitro. (A) BACH1‐knockdown (siBACH1‐1 and siBACH1‐2) and (B) ‐overexpressed (exBACH1) 786‐O, Caki‐1, and ACHN cells were subjected to determine mRNA (upper panels) and protein (lower panels) levels of BACH1 by quantitative RT‐PCR and western blot analysis, respectively. Results are expressed as mean ± SEM (upper panels) or representative of three experiments. **p < 0.01 and ***p < 0.001 by one‐way ANOVA combined with Dunnet's multiple comparisons test, compared with control siRNA‐introduced control (siCtrl) or empty vector‐introduced control (EV). (C) BACH1‐knockdown and (D) BACH1‐overexpressed cell lines were subjected to Transwell invasion assay with corresponding control cells (siCtrl or EV) (n = 4). **p < 0.01 and ***p < 0.001 by one‐way ANOVA combined with Dunnet's multiple comparisons test, compared with siCtrl or EV. Representative Diff‐Quick‐stained Transwell membranes using 786‐O cells are shown in left panels. Scale bar, 50 μm. (E) BACH1‐knockdown and (F) BACH1‐overexpressed cell lines were subjected to wound healing assay with corresponding control cells (siCtrl or EV) (n = 3). *p < 0.05, **p < 0.01, and ***p < 0.001 by one‐way ANOVA combined with Dunnet's multiple comparisons test, compared with siCtrl or EV. Representative images of migrated cells using 786‐O cells are shown in left panels. Scale bar, 50 μm.
