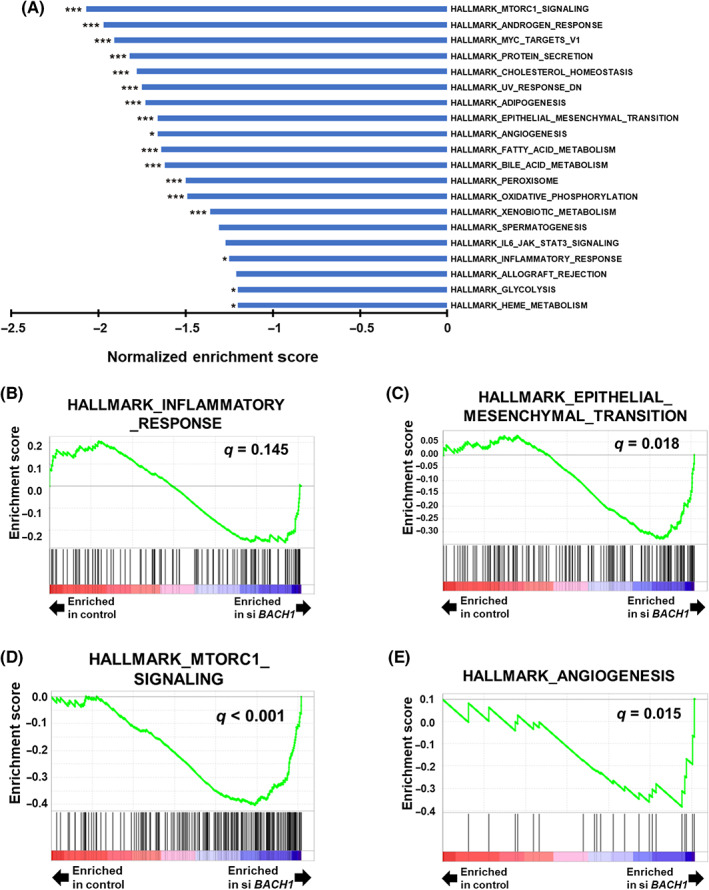
FIGURE 3.

Gene Set Enrichment Analysis (GSEA) of BACH1‐knockdown renal cell carcinoma cells. (A) Normalized enrichment scores of the top 20 downregulated pathways of hallmark gene sets enriched in BACH1‐knockdown 786‐O cells. *p < 0.05 and ***p < 0.001, compared with control siRNA‐introduced control. (B) Enrichment pattern of hallmark inflammatory response‐related, (C) epithelial–mesenchymal transition‐related, (D) mTORC1 signaling‐related, and (E) angiogenesis‐related gene sets determined by GSEA comparing BACH1‐knockdown (siBACH1) and control cells. q values are also indicated.
