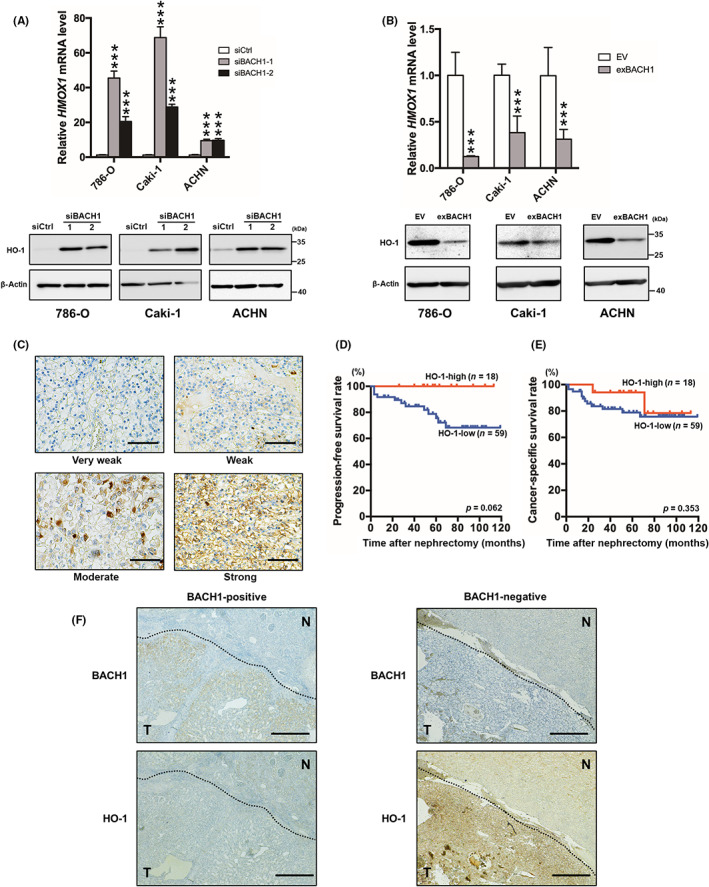
FIGURE 4.

Relationship between BACH1 and heme oxygenase‐1 (HO‐1) expression. (A) BACH1‐knockdown (siBACH1‐1 and siBACH1‐2) and (B) ‐overexpressed (exBACH1) 786‐O, Caki‐1, and ACHN cells were subjected to determine HMOX1 mRNA (upper panels) and HO‐1 protein (lower panels) levels by quantitative RT‐PCR and western blot analysis, respectively. Results are expressed as mean ± SEM (upper panels) or representative of three experiments. ***p < 0.001, compared with control siRNA‐introduced control (siCtrl) or empty vector‐introduced control (EV) by one‐way ANOVA combined with Dunnet's multiple comparisons test. (C) Immunohistochemical HO‐1 staining of clear cell renal cell carcinoma (ccRCC) specimens categorized into four grades; very weak, weak, moderate, and strong. The results shown are representative of 77 independent specimens. Original magnification, ×400. Scale bar, 50 μm. (D) Kaplan–Meier plots of progression‐free and (E) cancer‐specific survival rates for HO‐1‐high and ‐low nephrectomized ccRCC patients. p values calculated by a log–rank test are also indicated. (F) Immunohistochemical BACH1 (upper panels) and HO‐1 (lower panels) staining of BACH1‐positive (left panels) and ‐negative (right panels) ccRCC specimens in the continuous sections. Results shown are representative of 30 BACH1‐positive and 47 BACH1‐negative specimens. N, normal area; T, tumor area. Original magnification, ×100. Scale bar, 200 μm.
