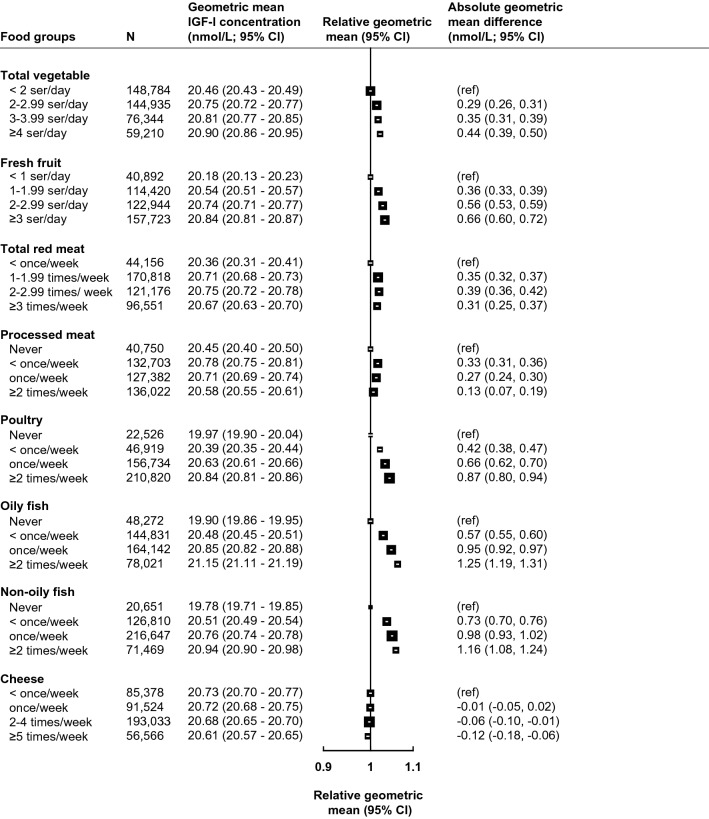
Fig. 1.
Food groups derived from the recruitment questionnaire in association with geometric mean concentrations of IGF-I (N = 438,453). All models are adjusted for sex, age at recruitment, region of recruitment, body mass index, height, physical activity, Townsend deprivation index, education, smoking, alcohol consumption, ethnicity, diabetes, and women-specific covariates: hormone replacement therapy use, oral contraceptive use, and menopausal status. See main text for covariate categories. CI confidence intervals, g grams, IGF-I insulin-like growth factor-I, N number of participants, ref reference, ser servings

